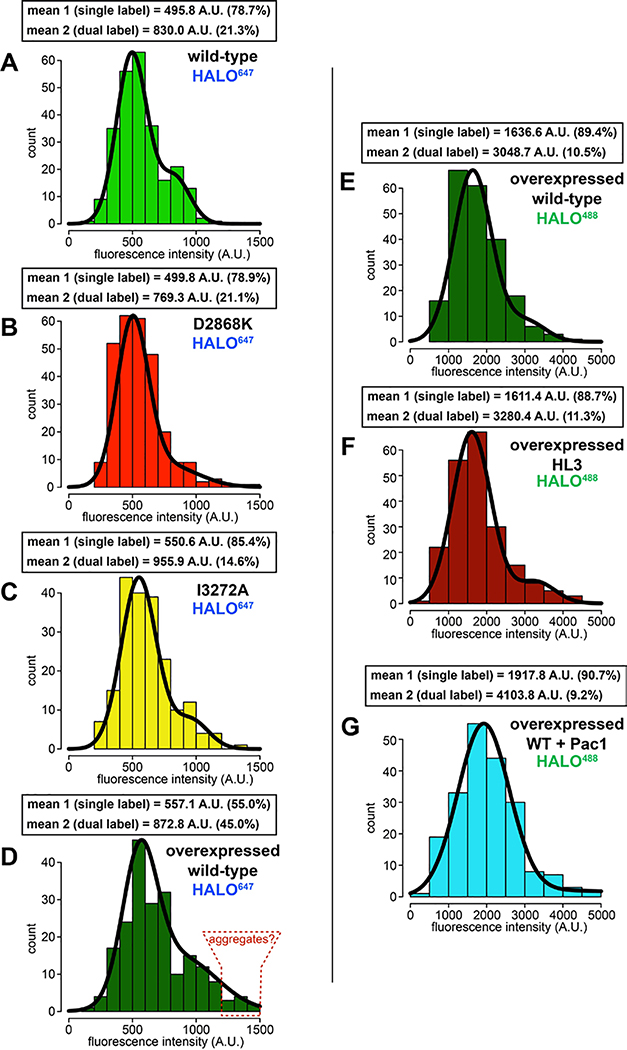
Extended Data Figure 2. Fluorescent intensity analysis of native and overexpressed single molecules of dynein.
Histogram of fluorescence intensity values for single molecules of motile dyneins, as indicated, along with accompanying Gaussian fits and modeled parameters (determined using the model-based clustering algorithm Mclust66). The percentages reflect the relative proportion of molecules that fall within each component (i.e., for mean 1, and mean 2). The two mean values for each likely represent single-labeled (mean 1) and dual-labeled (mean 2) dynein dimers, respectively. Red outlined region in panel D (“aggregates”), delineate particles with ~3-fold higher fluorescence intensity values than the single labeled complexes.

