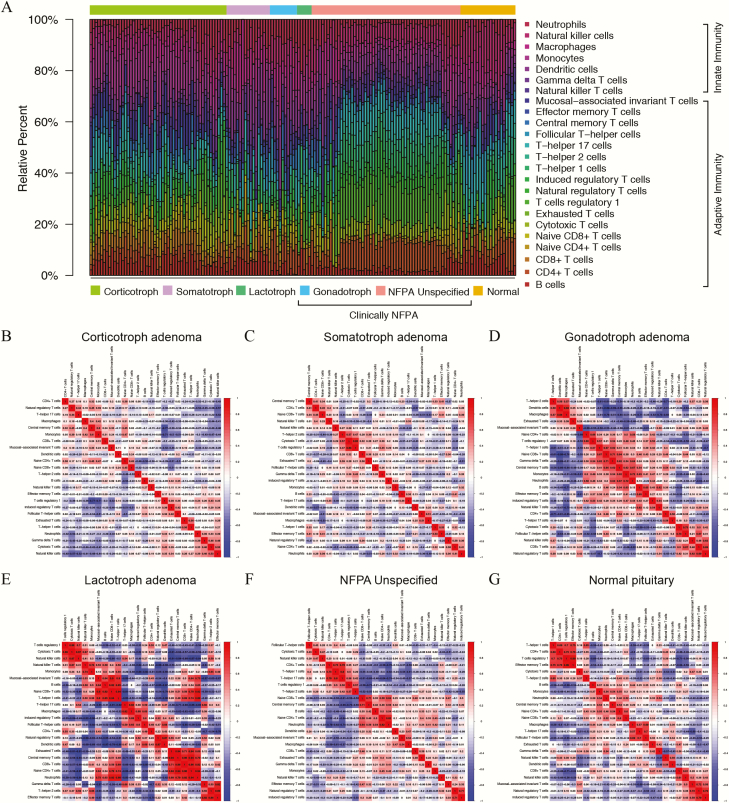
Figure 1.
Estimation of tumor-infiltrating immune cells (TIICs) in pituitary adenomas and normal pituitaries from GEO database based on ImmuCellAI. (A) The relative abundances of the 24 types of TIICs are indicated by various colors. (B-G) Correlation analyses of the TIICs in corticotroph adenomas, somatotroph adenomas, gonadotroph adenomas, lactotroph adenomas, clinically nonfunctioning adenomas (NFPAs), and normal pituitaries. The red color represents a positive correlation, and the blue color indicates a negative correlation.

