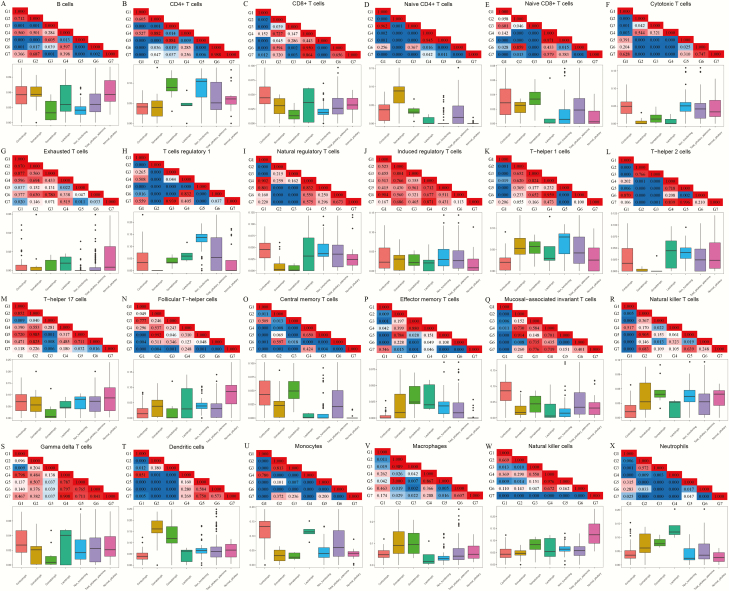
Figure 2.
Comparisons of the abundances of 24 types of tumor-infiltrating immune cells (TIICs) among the 5 histological subtypes of pituitary adenomas (PAs), all pituitary adenomas, and normal pituitaries. Lower panel: The box plots present the fraction of each immune cell in each of the 7 groups. Upper panel: Each square of the grid represents the P value of the difference between 2 groups. The red color represents P > 0.05, whereas the blue color indicates P < 0.05. G1, corticotroph adenoma group; G2, somatotroph adenoma group; G3, gonadotroph adenoma group; G4, lactotroph adenoma group; G5, clinically nonfunctioning adenoma group; G6, combined PA group; G7: normal pituitary group.

