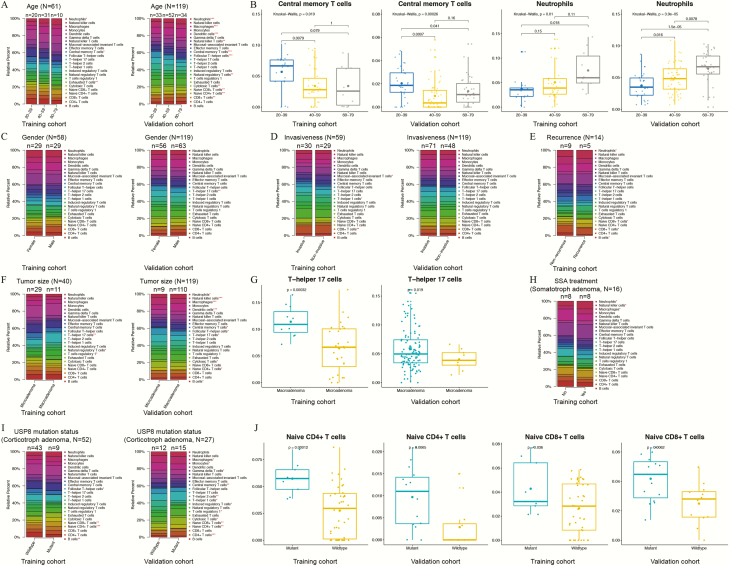
Figure 3.
Distributions of tumor-infiltrating immune cells (TIICs) in pituitary adenomas with different clinical and pathological parameters, including patient age (A), patient gender (C), invasiveness (D), recurrence status (E), tumor size (F), somatostatin analog (SSA) treatment before surgery (H), and ubiquitin-specific protease 8 (USP8) mutation status (I). Left panel: Training set from multiple GEO datasets. Right panel: Validation set from the E-MATB-7768 dataset. Asterisks indicate P < 0.05 among groups (***, P < 0.001; **, P < 0.01; *, P < 0.05). (B, G, J) Box plots of the TIICs with significant differences between groups in both the training and validation cohorts were displayed.

