Figure 5.
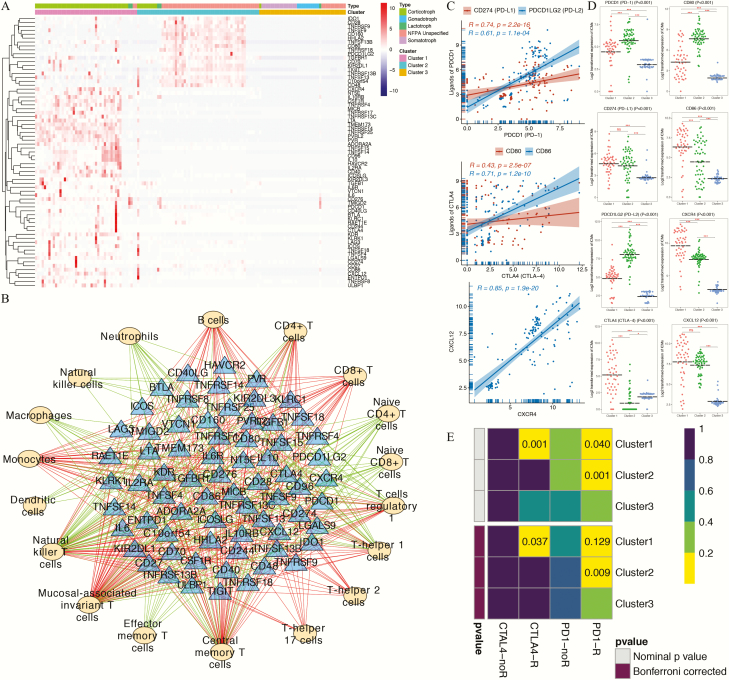
Correlation analyses between immune patterns and immune checkpoint molecules (ICMs). (A) Heatmap representing the expression profiles of 69 immune checkpoint genes among the 3 novel immune clusters and 5 histological pituitary adenoma (PA) subtypes. (B) Regulatory networks of ICMs and tumor-infiltrating immune cells (TIICs). The yellow ovals represent the TIICs, and the blue triangles represent the ICMs. The green/red lines indicate negative/positive correlations between the ICMs and the TIICs. (C) Regression analyses between immune checkpoint receptor-ligand pairs. (D) Expression of immune checkpoint receptors and ligands among the 3 immune clusters. (E) The subclass mapping analysis demonstrated that immune cluster 1 was more sensitive to anti-CTLA4 therapy (Bonferroni-corrected P = 0.037) and that immune cluster 2 was more sensitive to anti–programmed cell death protein 1 (PD1) therapy (Bonferroni-corrected P = 0.009). In this figure, “R” is short for immunotherapy respondent.

