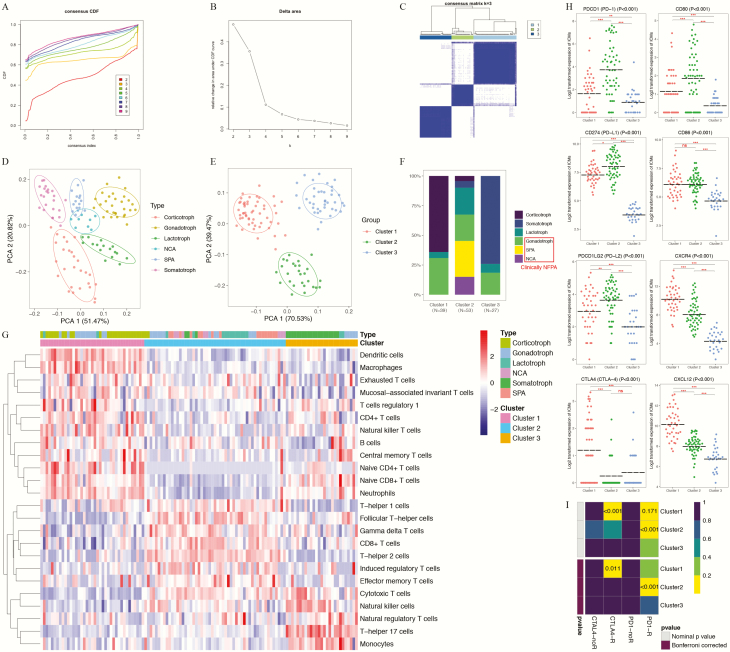
Figure 6.
Novel immune classifications of pituitary adenomas (Pas) in the validation set based on the patterns of immune cell infiltration analyzed using the unsupervised consensus clustering algorithm. (A) Cumulative distribution function (CDF) curves of the consensus score (k = 2-9). (B) Relative change in the area under the CDF curve (k = 2-9). (C) Consensus clustering matrix for k = 3, which was the optimal cluster number. (D) Principal component analysis (PCA) of the tumor-infiltrating immune cells (TIIC) patterns according to histological subtyping. (E) PCA according to the novel immune clusters. (F) Distributions of the 6 PA subtypes within the novel immune clusters. (G) Heatmap indicating the distributions of 24 types of TIICs among the 3 immune clusters. (H) Expression patterns of immune checkpoint receptors and ligands among the 3 immune clusters. (I) The subclass mapping analysis demonstrated that immune cluster 1 was more sensitive to anti-CTLA4 therapy (Bonferroni-corrected P = 0.011) and that immune cluster 2 was more sensitive to anti–programmed cell death protein 1 (PD1) therapy (Bonferroni-corrected P < 0.001). In this figure, “R” is short for immunotherapy respondent.

