Figure 3.
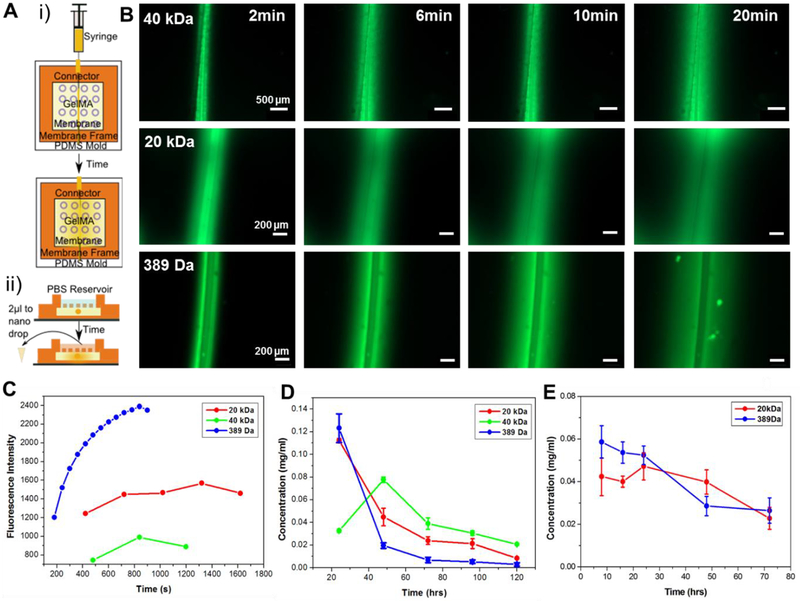
Diffusion profiles of FITC variants with different molecular weights through chip system. A) Schematic of tests to show diffusion: i) optical set-up using microscope images and ii) quantification using nanodrop to measure diffusion into a PBS reservoir. B) Fluorescence images over time of FITC-Dextran (40-kDa MW and 20-kDa MW respectively) and FITC isomer (389-Da MW) showing effect of molecular weight on diffusion time. C) Progression of fluorescent signal at a point 100μm away from microchannel as FITC diffuses through hydrogel system. D) Concentration of FITC isomer and -dextran with different molecular weights diffused through the porous PDMS membrane into PBS reservoir at 24 hr time points. E) Concentration of FITC isomer and -dextran with different molecular weights diffused through the porous PDMS membrane into PBS reservoir at 8 hr time points.

