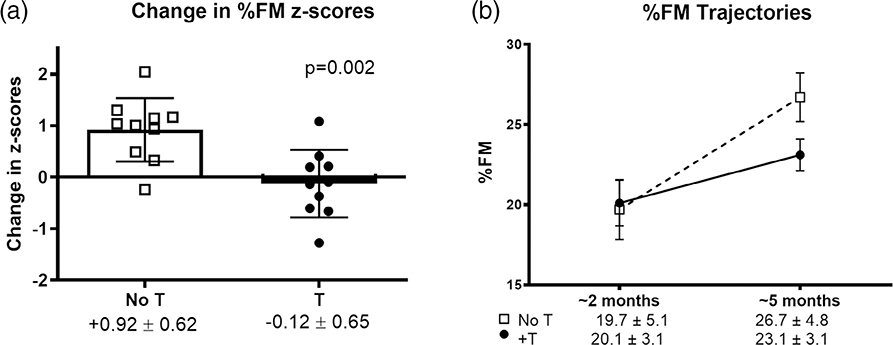
FIGURE 1.
(a) Change in %FM z scores was significantly greater in untreated (open squares) than in testosterone-treated (closed circles) boys with XXY. Bars and error bars represent mean and SD, respectively, and symbols represent individual participants. (b) Absolute %FM was similar at baseline but higher in the untreated boys after 3 months, although this difference did not reach statistical significance (p = .061). Error bars represent SEM. FM, fat mass; SD, standard deviation; T, testosterone treatment; SEM, standard error of the mean. Reprinted with permission (Davis et al., 2019)

