. 2020 Jul 21;9:e55263. doi: 10.7554/eLife.55263

Figure 3. LB affects the short-term expression of fear during early development.

(A) Schematic of experimental protocol (top). A mix of male and female mice were conditioned at PND 21 and tested at only one time point: 1 hr, 6 hr, 7 hr, or 7 days post-conditioning. Graph depicting changes in freezing levels of distinct cohorts of mice during recall tests at varying delays (bottom). LB mice had decreased freezing at 1 hr (t74 = 2.11, p=0.037), 24 hr (t48 = 3.41, p=0.0012) but not 6 hr (t55 = 1.66, p=0.10) or 7 days (t46 = 1.76, p=0.085) post-conditioning. (Ctrl n = 34, 30, 29, 27; LB n = 42, 27, 21, 21). (B) Re-analysis of data presented in panel A to reveal sex differences within the data. When compared to Ctrl males, Ctrl females had decreased freezing at 1 hr (t32 = 2.11, p=0.042), but not at 6 hr (t28 = 1.95, p=0.060), 24 hr (t27 = 1.89, p=0.069) or 7 days (t25 = 1.17, p=0.25) post-conditioning. LB males (t25 = 2.21, p=0.036) and LB females (t21 = 3.94, p=0.0007) had decreased freezing 24 hr post-conditioning when compared to sex matched controls. No other significant differences were observed between Ctrl males and LB males (1 hr: t42 = 1.32, p=0.19; 6 hr: t32 = 0.99, p=0.32; 7 days: t23 = 1.37, p=0.18), or between Ctrl females and LB females (1 hr: t30 = 0.85, p=0.39; 6 hr: t21 = 1.64, p=0.11; 7 days: t21 = 1.31, p=0.20). (Ctrl males n = 15, 19, 16, 14; Ctrl females n = 19, 11, 13, 13; LB males n = 29, 15, 11, 11; LB females n = 13, 12, 10, 10). (C) Depiction of the light/dark box used to assess anxiety-like behavior (top). A mix of male and female mice were placed in the dark side of the box, the latency to light (center) and the total time spent in the light side of the box (bottom) are shown. Total time spent in the light/dark box was 420 s. Age (F(2,135) = 19.2, p<0.0001), but not rearing condition (F(1,135) = 0.50, p=0.47) or age x rearing interaction (F(2,135) = 0.72, p=0.48), significantly affected the latency to exit the dark side of the box (center). PND 21 mice of both LB and control reared conditions took more time to enter the light side of the box when compared to mice from the same rearing condition at PND 28 (LB t135 = 3.63, p=0.0012; Ctrl t135 = 4.05, p=0.0003) and PND 35 (LB t135 = 3.09, p=0.0073; Ctrl t135 = 3.89, p=0.0005). However, a main effect of rearing condition on the total time mice spent in the light side of the light/dark box (F(2,135) = 3.91, p=0.022) was observed (bottom). A post-hoc analysis revealed that significant differences in rearing condition were only observed at PND 35 (t135 = 2.60, p=0.030). Furthermore, a significant main effect of age on the time spent in the light side (F(1,135) = 4.01, p=0.047) was observed. Specifically, control PND 35 mice spent significantly more time in the light side when compared to control reared mice aged PND 21 (t135 = 2.46, p=0.043) and PND 28 (t135 = 2.56, p=0.033). No interaction between age and rearing condition was observed (F(2,135) = 1.23, p=0.29). (Ctrl n = 14, 24, 23; LB n = 27, 22, 31). For effects of rearing condition by sex see Figure 3—figure supplement 1. Bars represent group means + / - SEM. Dots in panel (C) represent individual data points. Unpaired two-tailed student t-tests were used in (A) and (B). For (C) a two-way ANOVA followed by a Sidak’s multiple comparison analysis was used. *=p < 0.05, **=p < 0.01, ***=p < 0.001.

Figure 3.

Figure 3—figure supplement 1. LB did not affect anxiety like behavior at PND 21.

Figure 3—figure supplement 1.

(A) Drawing of the light/dark box behavioral apparatus. (B) Graph showing the time in seconds that it took mice to exit the dark side of the box and enter the light side. A three-way ANOVA revealed a main effect of age (F(2,129) = 18.22, p<0.0001) but not of sex (F(1,129) = 0.21, p=0.64) or rearing condition (F(1,129) = 0.39, p=0.53). No significant interactions between age, sex and rearing condition were revealed. A follow-up Sidak multiple comparison analysis revealed that, in general, mice took longer to exit the dark side of the box and enter the light side of the box at PND 21 when compared to PND 28 (t129 = 5.57, p<0.0001) or PND 35 (t129 = 5.05, p<0.0001). (C) Graph showing the total amount of time mice spent in the light side of the box. A three-way ANOVA for sex, rearing condition, and age revealed significant main effect of age (F(2,129) = 3.23, p=0.042) but not of rearing condition (F(1,129) = 3.08, p=0.081) or sex (F(1,129) = 1.12, p=0.29). No significant interactions were observed. (D) When using a three-way ANOVA to assess global effects of mouse entries into the light side of the light dark box, we found a main effect of age (F(2,129) = 4.13, p=0.018), rearing condition (F(1,129) = 78.08, p<0.0001), but not sex (F(1,129) = 0.029, p=0.86). For males, a follow-up two-way ANOVA between Ctrl and LB revealed a significant effect of rearing condition (F(1,71) = 31.31, p<0.0001), but not of age (F(2,71) = 0.96, p=0.38) or age by rearing condition (F(2,71) = 0.72, p=0.48). Follow-up analysis in males revealed significant differences between ctrl and LB mice at PND 28 (t71 = 3.66, p=0.0014) and 35 (t71 = 4.23, p=0.0002), but not at 21 (t71 = 2.03, p=0.13). For females, a two-way ANOVA between Ctrl and LB revealed a significant effect of rearing condition (F(1,58) = 67.27, p<0.0001), age (F(2,58) = 6.45, p=0.0029), and age by rearing condition (F(2,58) = 4.06, p=0.022). Follow-up analysis in females revealed significant differences between ctrl and LB mice at PND 28 (t58 = 5.37, p<0.0001) and 35 (t58 = 6.90, p<0.0001), but not at 21 (t58 = 2.28, p=0.076). Ctrl males n = 8, 12, 15; Ctrl females n = 6, 12, 8; LB males n = 14, 14, 14; LB females n = 13, 8, 17. Dots represent individual data points. For all graphs the mean and SEM are presented. A three-way ANOVA was used to test for main effects of sex, age, and rearing condition. A two-way ANOVA followed by Sidak’s multiple comparison analysis was used to test for difference in rearing condition across age within a given sex. *=p < 0.05, **=p < 0.01, ***=p < 0.001.
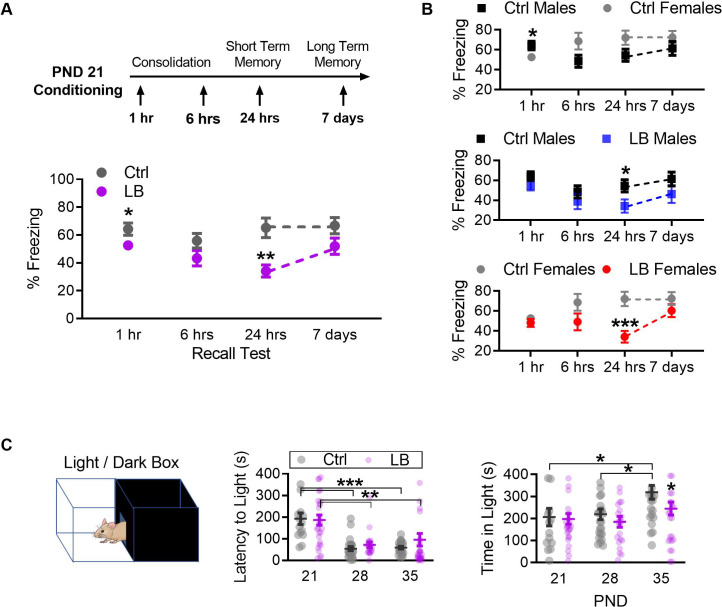
Figure 3—figure supplement 2. LB mice spent more time performing head dips in the elevated plus maze (EPM) at PND 21.

Figure 3—figure supplement 2.

(A) Ctrl and LB mice spent a similar percentage of their time in the open arms of the EPM (F(1,45) = 0.30, p=0.58). No sex difference (F(1,45) = 0.31, p=0.57) or sex by rearing condition interactions (F(1,45) = 0.53, p=0.46) were observed for the percent time mice spent in the open arms. Further, no main effects were observed for the total distance traveled on the EPM (sex: F(1,45) = 3.52, p=0.067; rearing condition: F(1,45) = 1.64, p=0.20; sex x condition interaction: F(1,45) = 0.41, p=0.52). (B) When analyzing the time and number of times that the mouse looked over the edge of the open arms of the EPM (head dipping), we found that LB mice spent more time head dipping (F(1,45) = 4.30, p=0.043), but did not engage in more bouts (F(1,45) = 0.85, p=0.35). No main effect of sex or interaction was observed for the total amount of time mice spent head dipping (sex: F(1,45) = 0.63, p=0.42; sex x rearing condition: F(1,45) = 0.12, p=0.72), or for the total number of head dips (sex: F(1,45) = 2.28, p=0.13; sex by rearing condition: F(1,45) = 0.00047, p=0.98). Ctrl males n = 11; Ctrl females n = 10; LB males n = 18; LB females n = 10. Dots represent individual data points. For all graphs, the mean and SEM are presented. A two-way ANOVA was used to test differences between sexes and rearing conditions. *=p < 0.05, **=p < 0.01, ***=p < 0.001.
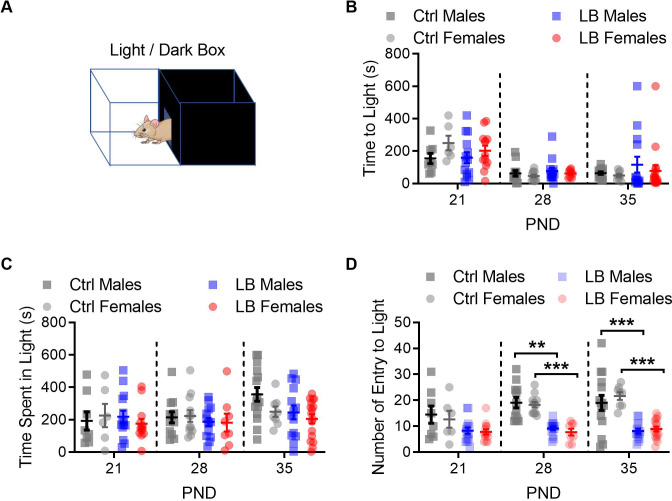
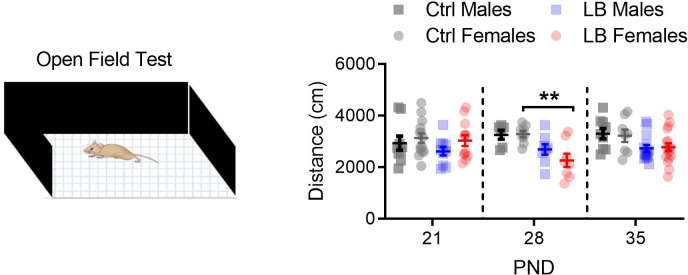
Figure 3—figure supplement 3. LB did not affect locomotion at PND 21.

Figure 3—figure supplement 3.

We used a three-way ANOVA to assess global effects of rearing condition on locomotion in an open-field assay. We found a main effect rearing condition (F(1,111) = 18.08, p<0.0001), but not of age (F(2,111) = 0.42, p=0.65) or sex (F(1,111) = 0.063, p=0.80). For males, a follow-up two-way ANOVA between Ctrl and LB revealed a significant effect of rearing condition (F(1,50) = 8.97, p=0.0042), but not age (F(2,50) = 0.92, p=0.40) or age by rearing condition (F(2,50) = 0.29, p=0.74). Follow-up analysis in males revealed no significant simple effects between ctrl and LB mice at any of the ages tested (PND 21: t50 = 1.17, p=0.57; PND 28: t50 = 1.79, p=0.22; PND 35: t50 = 2.28, p=0.078). For females, a two-way ANOVA between Ctrl and LB revealed a significant effect of rearing condition (F(1,61) = 9.48, p=0.0031), but not age (F(2,61) = 1.08, p=0.34) or age by rearing condition (F(2,61) = 2.41, p=0.097). Follow-up analysis in females revealed significant differences between ctrl and LB mice at PND 28 (t61 = 3.09, p=0.0090), but not at 21 (t61 = 0.37, p=0.97) or 35 (t61 = 1.56, p=0.32). Ctrl males n = 9, 6, 9; Ctrl females n = 14, 8, 8; LB males n = 10, 8, 14; LB females n = 12, 8, 17. Dots represent individual data points. For all graphs, the mean and SEM are presented. A three-way ANOVA was used to test for main effects of sex, age, and rearing condition. A two-way ANOVA followed by Sidak’s multiple comparison analysis was used to test for difference in rearing condition across age within a given sex. *=p < 0.05, **=p < 0.01, ***=p < 0.001.
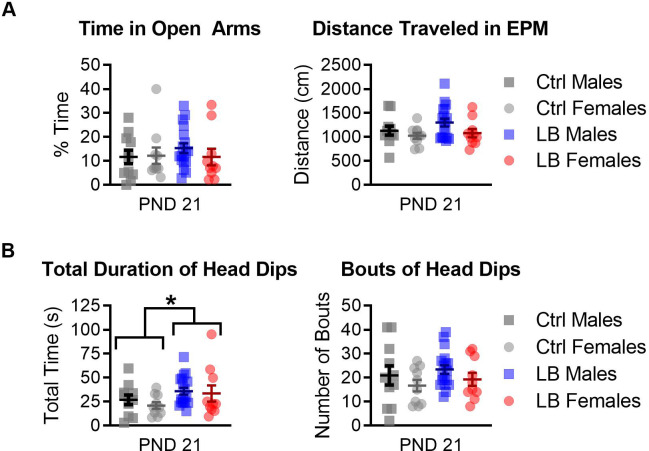
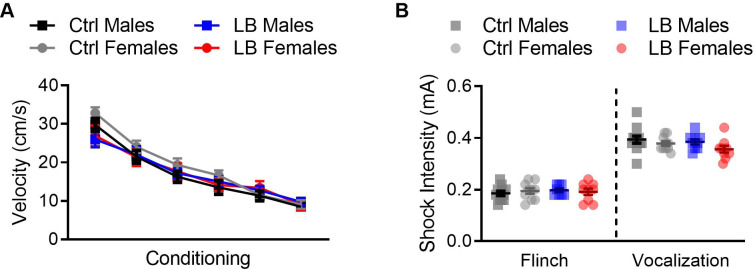
Figure 3—figure supplement 4. LB did not affect somatosensation at PND 21.

Figure 3—figure supplement 4.

(A) To assess if LB affected the response of mice to the conditioning foot-shocks at PND 21, we plotted the mean velocity of mice during the one second foot-shock. A three-way repeated measures ANOVA did not reveal effects of rearing condition (F(1,142) = 0.70, p=0.40), sex (F(1,142) = 1.32, p=0.25), tone trial x sex (F(5,710) = 0.30, p=0.91), rearing condition x sex (F(1,142) = 1.41, p=0.23), tone x rearing condition x sex (F(5,710) = 0.29, p=0.91). However, we did find that a significant effect of tone trial (F(4.436,629.9) = 95.78, p<0.0001), showing that the velocity of the mice decreased as tone trials progressed, and a significant effect of tone by rearing condition (F(5,710) = 2.28, p=0.044). (Ctrl males n = 39, LB males n = 38, Ctrl females n = 39, LB females n = 30). (B) At PND 21, no main effects were observed for the minimum foot-shock intensity required for mice to flinch (sex: F(1,35) = 0.017, p=0.89; rearing condition: F(1,35) = 0.23, p=0.62; interaction: F(1,35) = 0.60, p=0.44) or audibly vocalize (sex: F(1,36) = 3.42, p=0.072; rearing condition: F(1,36) = 1.72, p=0.19; interaction: F(1,36) = 0.32, p=0.57). For flinch: Ctrl males = 12, females = 10; LB males = 8, females = 9. For audible vocalization: Ctrl males = 12, females = 10; LB males = 9, females = 9. For all graphs the mean and SEM are presented. A three-way repeated measure ANOVA was used to assess differences in shock reactivity during conditioning. A two-way ANOVA followed by Sidak’s multiple comparison analysis was used to assess differences in flinching and vocalization. *=p < 0.05, **=p < 0.01, ***=p < 0.001.