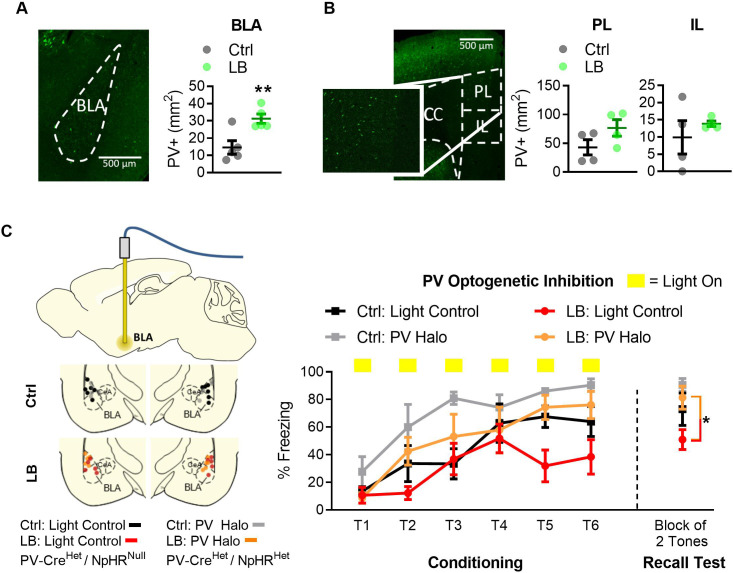
Figure 5. Optogenetic inactivation of parvalbumin-positive (PV+) cells was sufficient to increase fear expression at PND 22 in LB mice.
(A) Representative image of PV-positive cells in BLA of Het PV-Cre/Het floxed halo (‘PV Halo’) mouse line (left). LB increased the density of PV-positive cells in the BLA (t8 = 3.49, p=0.0081; n = 5 per group). (B) Representative image of PV+ cells in the mPFC of a PV Halo (left). LB did not affect the density of PV-positive cells in PL (t6 = 1.72, p=0.13) or IL (t6 = 0.80, p=0.45) compared with control reared mice (n = 4 per group). (C) Graph showing conditioning and recall test. Optogenetic inhibition occurred during the conditioning tones. Ctrl and LB reared Light control (Het PV-Cre/null floxed Halo) and PV Halo (Het PV-Cre/Het floxed Halo) mice were bilaterally implanted with an optical fiber into BLA, optic fiber placements are shown (left). To assess effects of optogenetic inhibition of PV cells in LB reared mice we compared LB light controls versus LB PV Halo mice. When analyzing PV inhibition in LB mice, a main effect of tone presentation (F(5,45) = 6.97, p<0.0001) was observed, indicating mice had learned the tone/foot shock association. Optogenetic inactivation of PV positive cells in LB reared mice increased freezing during conditioning (F(1,9) = 6.21, p=0.034), and resulted in an increase in freezing on the recall test 24 hr later (t9 = 2.69, p=0.024). No interaction between tone presentation and experimental condition was observed (F(5,45) = 1.55, p=0.19) between LB light control and LB PV Halo mice. For LB: light control n = 5, for LB: PV Halo n = 6. When assessing the effects of PV-positive cell inhibition between Ctrl: Light control and Ctrl: PV Halo mice, a repeated measure ANOVA revealed a main effect of tone presentation (F(5,45) = 9.08, p<0.0001), and optogenetic inactivation (F(1,9) = 9.5, p=0.013). No main effect of tone by optogenetic inactivation (F(5,45) = 0.96, p=0.44) was observed. No differences in memory retrieval were observed between the Ctrl: light control and the Ctrl: PV Halo mice (t9 = 1.29, p=0.22). For additional locomotion controls and cFos analysis of inhibition see Figure 4—figure supplement 1. A repeat measure two-way ANOVA was used to assess differences in fear conditioning, for all other analysis two-tailed unpaired student t-tests were used. Bars represent group means + / - SEM. *=p < 0.05, **=p < 0.01, ***=p < 0.001.


