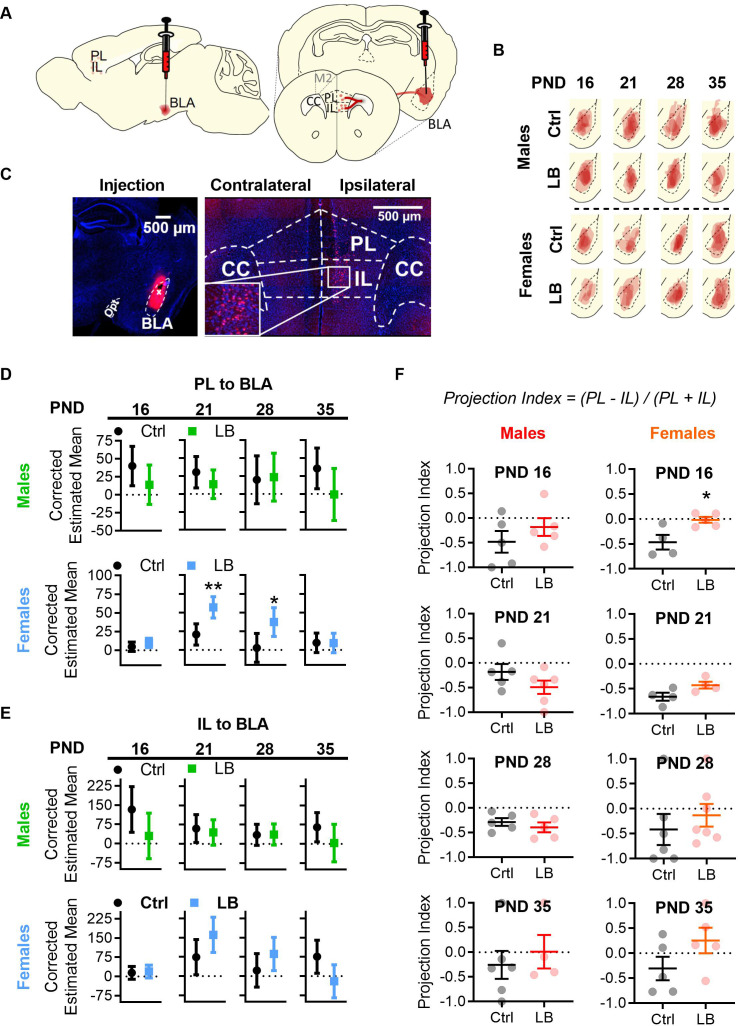
Figure 6. LB altered mPFC to BLA anatomical connectivity in females but not males.
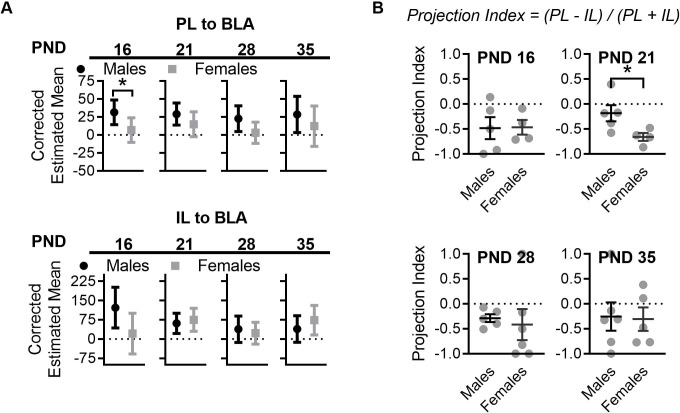
(A) Diagram of CTB 594 retrograde injection into the BLA. (B) Tracings of CTB injections into the BLA. (C) Example picture of injection in the BLA (left), and of cells labelled in mPFC (right). (D) Graphs showing the differences in PL to BLA corrected estimated mean densities with 95% confidence intervals from infancy (PND16) into adolescence (PND 35). In males, the density of PL to BLA projecting cells in LB mice did not differ at PND 16 (F(1,6) = 2.46, p=0.16), 21 (F(1,7) = 1.69, p=0.23), 28 (F(1,6) = 0.035, p=0.85) or 35 (F(1,6) = 3.08, p=0.13) when compared to control mice. In females, a significant increase in PL to BLA projecting cells density was observed in LB mice at PND 21 (F(1,4) = 21.74, p=0.010) and 28 (F(1,10) = 7.44, p=0.021) but not at PND 16 (F(1,6) = 1.47, p=0.27) or 35 (F(1,6) = 0.001, p=0.97). (E) Graphs showing the differences in IL to BLA corrected estimated mean densities with 95% confidence intervals from infancy into adolescence. LB did not affect the density of IL to BLA projections at any age for males (16: F(1,6) = 3.71, p=0.10; 21: F(1,7) = 0.22, p=0.65; 28: F(1,6) = 0.003, p=0.958; 35: F(1,6) = 2.17, p=0.19) or females (16: F(1,6) = 0.091, p=0.77; 21: F(1,4) = 5.35, p=0.082; 28: F(1,10) = 2.212, p=0.168; 35: F(1,6) = 5.10, p=0.065). For panels D and E (Ctrl male n = 5, 5, 5, 6; LB male n = 5, 6, 5, 4; Ctrl female n = 5, 4, 7, 5; LB female n = 5, 4, 7, 5). (F) Graphs showing the differences in projection index from infancy into adolescence. LB altered the balance of PL and IL projections to BLA at PND 16 in females (t7 = 3.09, p=0.0175). No other significant differences were observed in the projection index for males (16: t8 = 1.05, p=0.32; 21: t9 = 1.47, p=0.17; 28: t8 = 0.83, p=0.42; 35: t8 = 0.60, p=0.56) or females (21: t6 = 2.22, p=0.068; 28: t11 = 0.75, p=0.46; 35: t8 = 1.61, p=0.14). (Ctrl male n = 5, 5, 5, 6; LB male n = 5, 6, 5, 4; Ctrl female n = 4, 4, 6, 5; LB female n = 5, 4, 7, 5). For D and E dots represent estimated group means with 95% confidence intervals. Estimated means were derived from ANCOVA analysis using two covariates: 1) the area of the CTB injection and 2) the area of BLA where the injection occurred. An ANCOVA was run per age per sex. Statistical significance was determined through post ANCOVA univariate comparison. For panel F, dots represent individual values, bars represent group mean + / - SEM. Unpaired two-way student t-tests were used to assess statistical significance between control and LB mice per age per sex in panel F. *=p < 0.05, **=p < 0.01, ***=p < 0.001.


