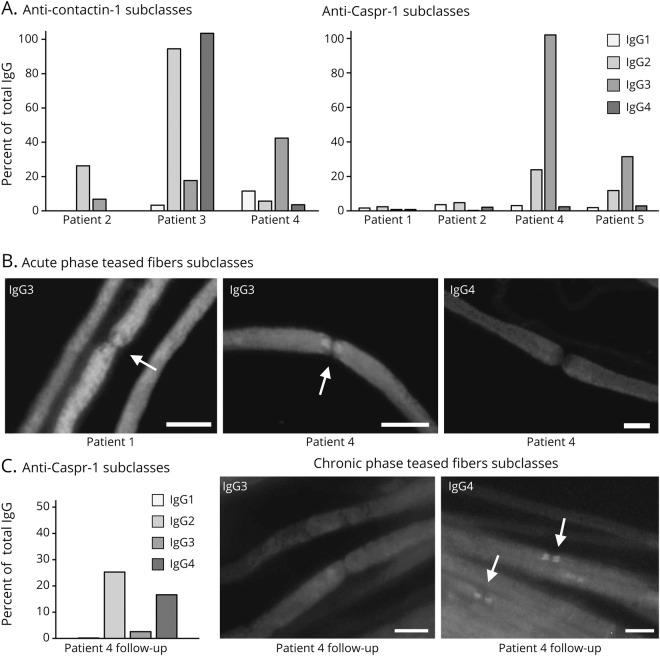
Figure 2. Serum subclass analysis at baseline and at follow-up with IgG subclass switch.
(A) Results of anti–contactin-1 and anti–Caspr-1 ELISA with baseline sera and subclass-specific IgG1-4 autoantibodies (grayscale) are shown as % of the OD of the total IgG (using anti-human IgG autoantibody) on y-axis. In patient 1, ELISA IgG subclasses were not measurable. ELISA revealed mainly IgG2 subclass in patient 2 (GBS), IgG2/IgG4 in patient 3 (A-CIDP), and IgG2/3 in patients 4 and 5 (A-CIDP). (B) Acute phase teased fibers subclass analysis with baseline sera showed binding to the paranodal regions (arrows) only when using IgG3-specific secondary antibody in patients 1 (GBS) and 4 (A-CIDP), visualized by photomicrographs of single immunofluorescence staining on teased fibers. (C) Anti–Caspr-1 IgG subclass ELISA with follow-up serum of patient 4 now revealed IgG 2/4 subclass. Photomicrographs show immunofluorescence staining of murine teased fibers with subclass-specific IgG3 and IgG4 autoantibodies at follow-up. Paranodal binding disappeared using IgG3 antibody, but occurred using IgG4 subclass-specific antibody, proving subclass switch in patient 4. Scale bar = 10 µm. A-CIDP = acute-onset chronic inflammatory demyelinating polyradiculoneuropathy; GBS = Guillain-Barré syndrome.

