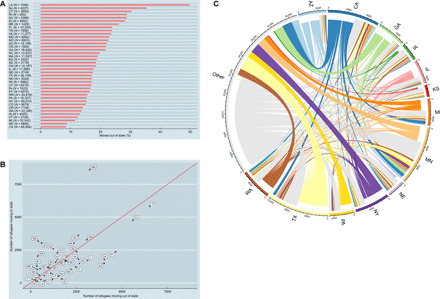
Fig. 1. Secondary migration of refugees, 2000–2014.

(A) Proportion of refugees who moved out of their arrival state by the time they had applied for LPR status. (B) Total number of refugees moving in/out of each arrival state by the time they had applied for LPR status. Points above (below) the diagonal represent states receiving a net increase (decrease) in refugees due to secondary migration. (C) Refugee secondary migration flows between states, using the intersection of the top 8 states based on either the numbers arrivals, number of refugees at time of adjustment, or number of net moves. Flows with less than 10 total movers are omitted. All panels focus on the refugees who arrived in those 39 states that received at least 1000 refugees over the study period. N = 443,546.
