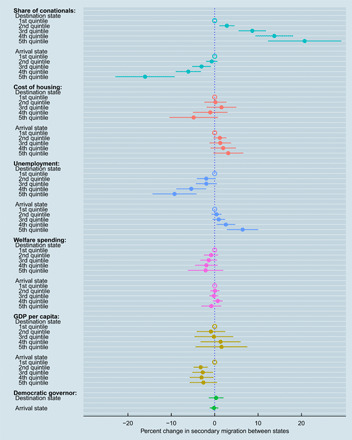
Fig. 3. Expected change in secondary migration, by state characteristics.

Estimates from a gravity model regressing the log total secondary migration flows on sending and destination state characteristics (coarsened into five equally sized bins). Individual-level flows are aggregated to the state-year-origin level. Models control for the initial stock of refugees in each arrival state-year-origin and include state pair and arrival year fixed effects. Lines represent 95% robust confidence intervals, two-way clustered on arrival and destination state. N = 197,343 state-to-state-by-origin flows and includes states that received at least 1000 refugees over the study period (2000–2014).
