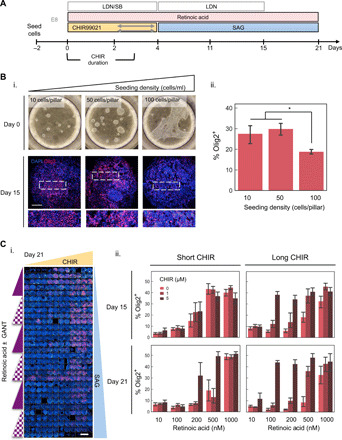
Fig. 2. Early culture parameters play a large role in OPC differentiation efficiency.

(A) Timeline of key parameters in the early phase of OPC differentiation. (B) i. Bright-field images of 3D H9 microculture sites at day 0 seeded with varying cell densities and the immunocytochemistry images of Olig2 (red) expression at day 15. Scale bar, 100 microns. ii. Quantification of day 15 Olig2 expression with respect to seeding density and SAG dose. *P value < 0.05 using Tukey’s Method for multiple comparisons. (C) i. Montage of 360 fluorescence confocal images representing 90 unique differentiation timelines on a single microchip stained for Hoechst (blue) and Olig2 (red) after 21 days of differentiation. ii. Trends in Olig2 expression at days 15 and 21 in various CHIR and RA concentrations and durations (short CHIR, days 0 to 1; long CHIR, days 0 to 3). Error bars represent 95% confidence intervals from four technical replicates.
