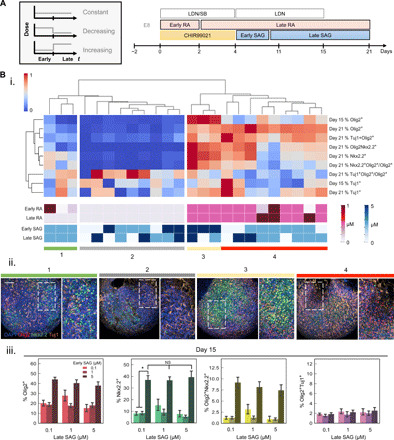
Fig. 4. Fine-tuning temporal profiles of RA and SAG to influence OPC specification.

(A) Timeline of early and late windows for RA and SAG exposure. (B) i. Hierarchical cluster analysis of standardized (z score) phenotypic responses to temporal changes in RA and SAG dose during OPC differentiation. ii. Representative immunocytochemistry images of each major category of endpoint population phenotype mix of Olig2 (red), Nkx2.2 (green), and Tuj1 (orange) expression. Scale bar, 100 μm. iii. Olig2, Nkx2.2, and coexpression of Olig2+Nkx2.2+ and Olig2+Tuj1+ at day 15 in response to time-varying doses of SAG. Error bars represent 95% confidence intervals from four technical replicates. *P value < 0.05.
