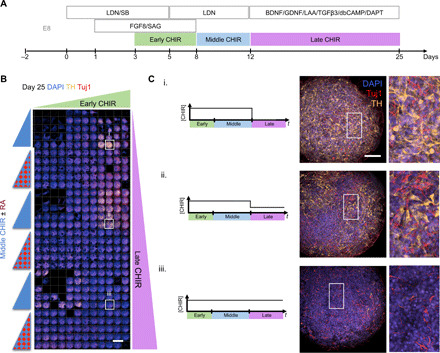
Fig. 6. A generalizable platform for screening parameters for optimization of upstream CRT production.

(A) Timeline of small-molecule addition for differentiation of mDA neurons from hPSCs. (B) Montage of 90 unique differentiation timeline to test temporal profiles of CHIR dose stained for tyrosine hydroxylase (TH) and Tuj1. Scale bar, 1 mm. (C) Immunocytochemistry images of i. low, ii. medium, and ii. high proportions of TH+ (yellow) neurons (red) dependent on the temporal profile of CHIR exposure. Scale bar, 100 μm.
