. 2020 Aug 3;9:e59186. doi: 10.7554/eLife.59186

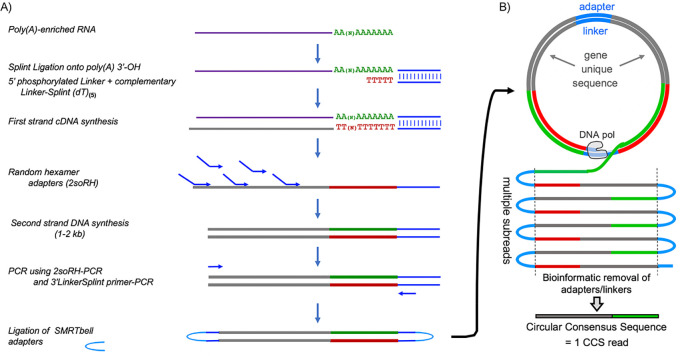
Figure 1. Flow diagram of SM-PAT-seq library preparation, sequencing and read output.

(A) Overview of library construction for SM-PAT-seq, depicting production of a circular DNA from a single mRNA molecule with a specific poly(A) length. (B) Schematic production of one circular consensus sequence (CCS) read (bottom) from the mRNA-derived DNA template as performed by the Pacific Biosciences Sequel system (see text); DNA pol = DNA polymerase.

Figure 1.

Figure 1—figure supplement 1. Analysis of SM-PAT-seq performance.

Figure 1—figure supplement 1.

(A) Analysis of libraries from a MEF RNA sample prepared for RNA-seq or SM-PAT-seq. Following RNA-seq, transcripts were aligned with Salmon (Patro et al., 2017) against GENCODE v23 transcripts to generate transcripts per million (TPM) abundance measures. Following SM-PAT-seq and transcript assignment of reads, counts were converted to TPM. Data for all non-zero genes were evaluated for Spearman correlation of abundance, using the base R package (Bates et al., 2020). R2 correlation = 0.58 with p value of 2.2e-16. B) Plot of unique vs. total reads, with the dashed line representing the theoretical perfect library where every sequenced molecule is unique; numerals on axes are millions. The dark pink and blue lines represent actual data for the HEK293 and MEF library data sets, with light shaded regions representing 90% confidence. The data indicate that >99.03% and 99.04% of SM-PAT-seq CCS reads obtained from these libraries were unique.