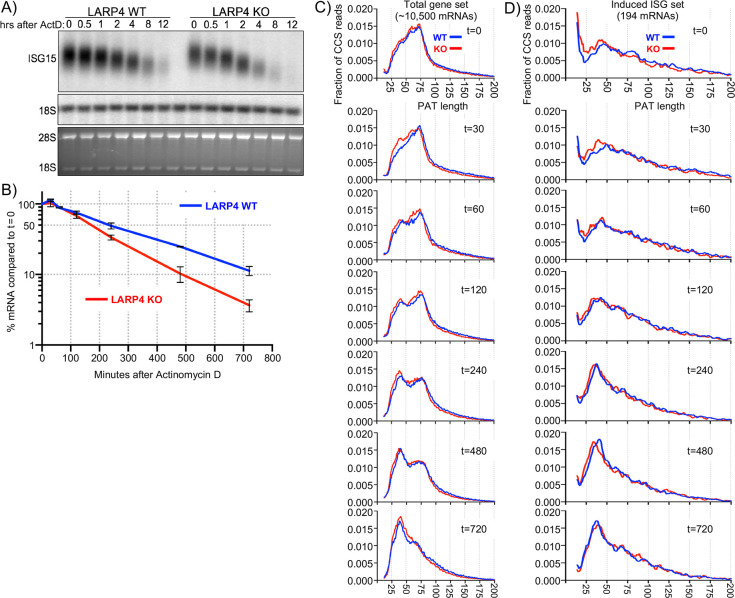
Figure 5. SM-PAT-seq decay analysis of total and ISG mRNAs.
Duplicate sets of LARP4 KO and WT MEFs were treated with IFNα, followed by transcription inhibition with actinomycin D, RNA isolation at multiple times thereafter, and analysis as follows. (A) Northern blot probed for ISG15 mRNA and 18S rRNA (top panel); stained gel prior to transfer (bottom panel). (B) Quantitation of biological duplicate northern data. ISG15 signal was normalized to 18S rRNA; t = 0 was set to 100%, error bars represent the spread. (C) Fraction of SM-PAT-seq CCS reads vs. PAT length for each time point after ActD addition for the gene set of ~10,500 mRNAs as in Figure 3A. (D) Fraction of SM-PAT-seq CCS reads vs. PAT length for each time point for the ISG set of 194 mRNAs. For C and D, the mitochondrial-encoded reads were filtered out.


