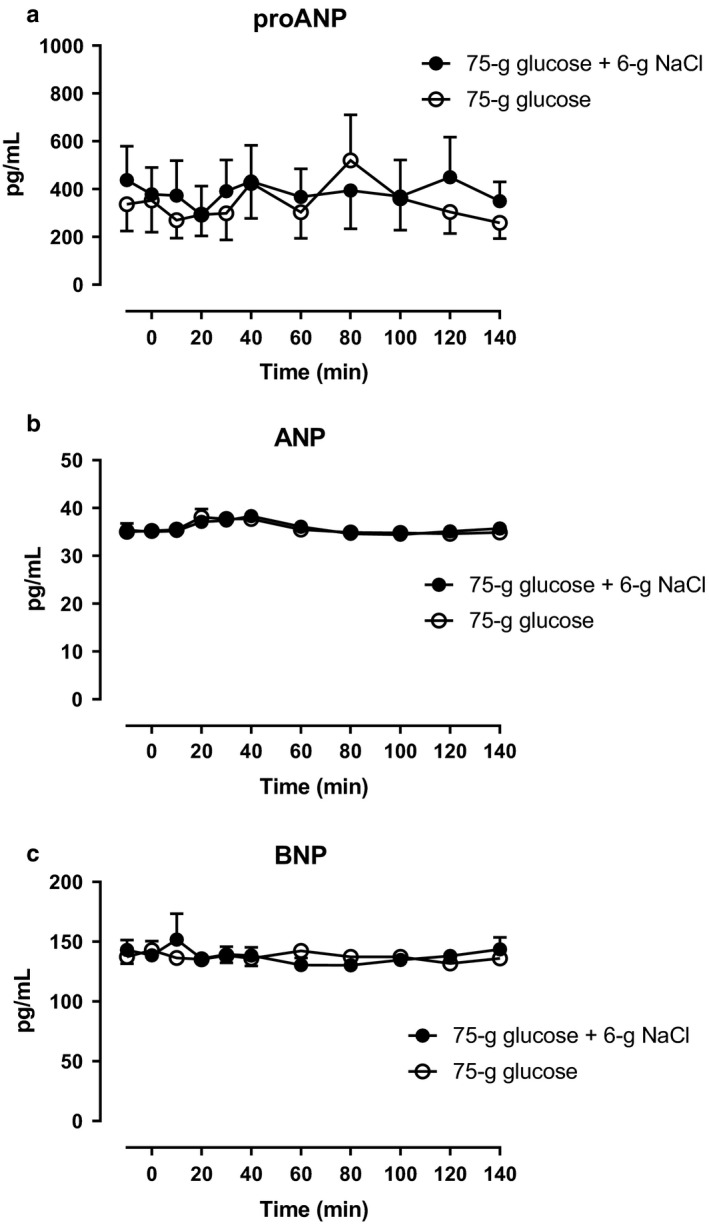
Figure 7.

Arterial plasma concentrations of (a) proANP, (b) ANP, and (c) BNP after a 75‐gram oral glucose load (75 g of glucose) with 6‐gram oral sodium chloride load (6 g of NaCl) (filled circles) or 75 g of glucose alone (open circles) from 0 to 140 min. Data are presented as means ± SE
