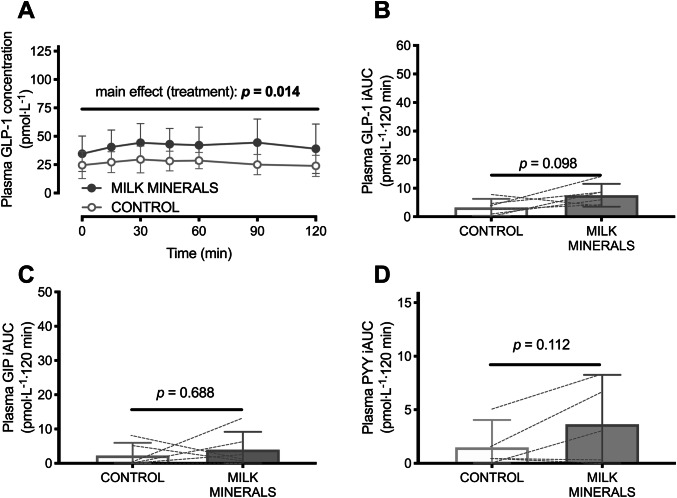
Fig. 5.
Plasma GLP-1 concentrations (a) and time-average incremental area under the curve (iAUC) values for plasma GLP-1 (b), GIP (c) and PYY (d) following ingestion of milk minerals rich in calcium (MILK MINERALS) or the vehicle of ingestion (CONTROL; 500 mL water plus 80 mg sucralose) in healthy men and women. Data are means ± 95% CI, n = 6. GLP-1 glucagon-like peptide-1, GIP glucose-dependent insulinotropic polypeptide, PYY peptide tyrosine tyrosine

