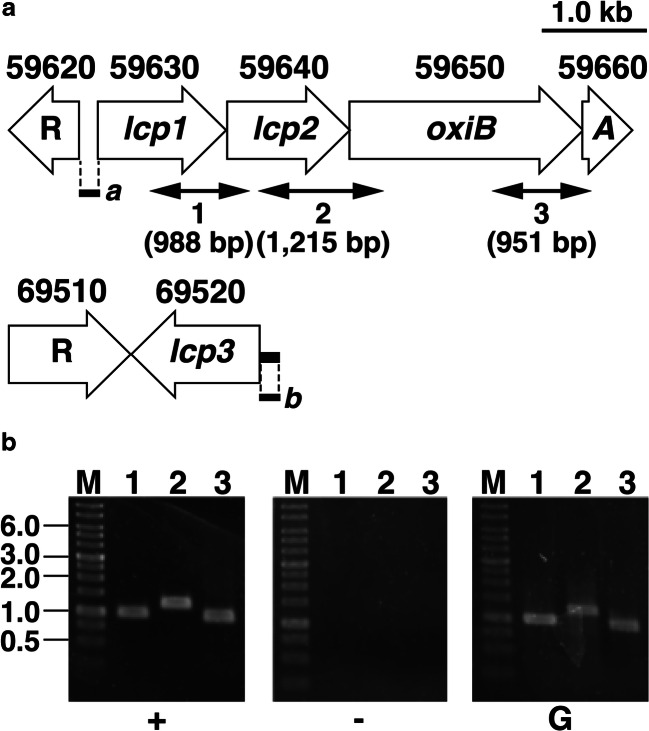
Fig. 2.
The organization and transcription of the lcp gene clusters. a Open arrows indicate the genes. Locus tags are indicated above the genes. The putative TATRs-coding genes are indicated by R. Double-headed arrows immediately below the gene cluster diagram indicate the locations of the amplified RT-PCR shown in panel B. Boldface bars a and b indicate the positions of DNA probes used in EMSA shown in Fig. 5. b The results of agarose gel electrophoresis of RT-PCR products obtained with primers targeting 1 (expected size 988 bp), 2 (expected size 1215 bp), and 3 (expected size 951 bp) are shown. The amplified regions and the primer sequences are indicated in panel A and Table 1, respectively. M, molecular size markers; + and -, RT-PCR with and without RT, respectively; G, control PCR with the genomic DNA

