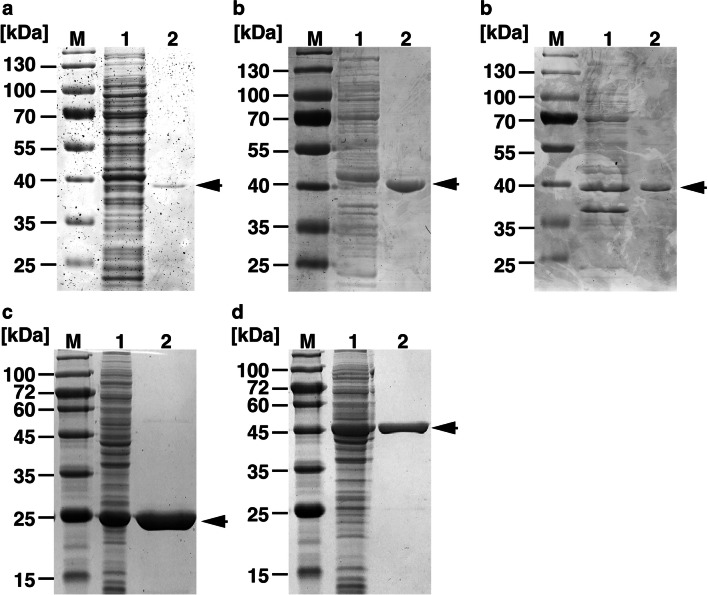
Fig. 3.
SDS-PAGE analysis of protein fractions. Proteins were separated on a SDS 12% polyacrylamide gel and stained with Coomassie brilliant blue. Lcp1-his, Lcp2-his, and Lcp3-his, ACTI_59620-his, and ACTI_69510-his are shown in panels (a), (b), (c), (d), and (e), respectively. M, molecular weight markers; 1, crude extract of the E. coli cells containing lcp1, lcp2, lcp3, ACTI_59620, or ACTI_69510; 2, purified proteins. Molecular masses are given on the left

