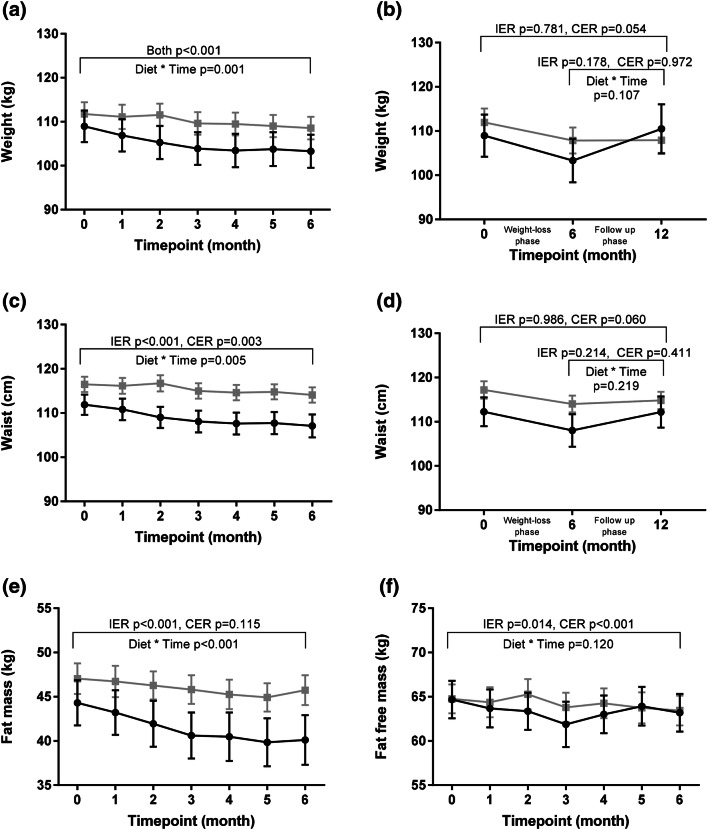
Fig. 2.
Changes in anthropometry. Intermittent energy restriction (IER): black circle. Continuous energy restriction (CER): grey square. Presented as mean ± SEM. Statistical comparisons between groups conducted via repeated measures analysis of variance. Within-group changes assessed via paired t tests. N = 27 IER, N = 39 CER (a, c, e, f) or N = 17 IER, n = 30 CER (b, d)

