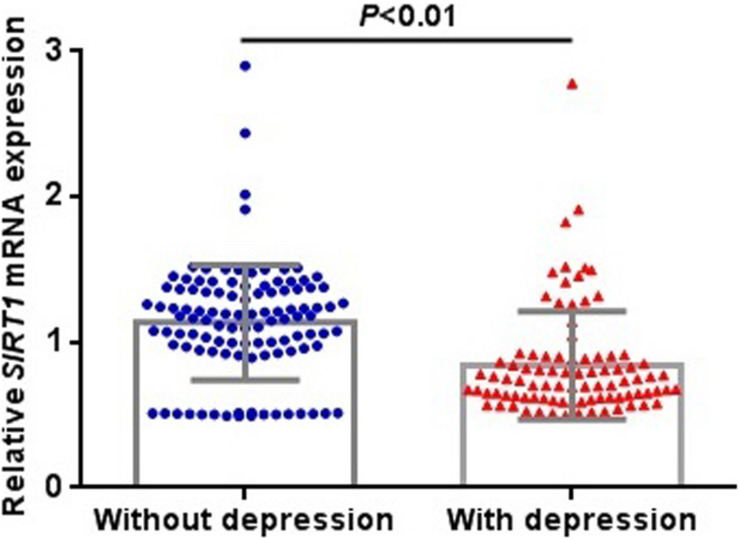
FIGURE 1.
Differential expression of SIRT1 mRNA in brain between patients with schizophrenia and healthy controls. Each bar represents the average level of SIRT1 mRNA expression. Error bars represent the standard deviation of the mean value. Data was extracted from the SZDB database (http://www.szdb.org/).

