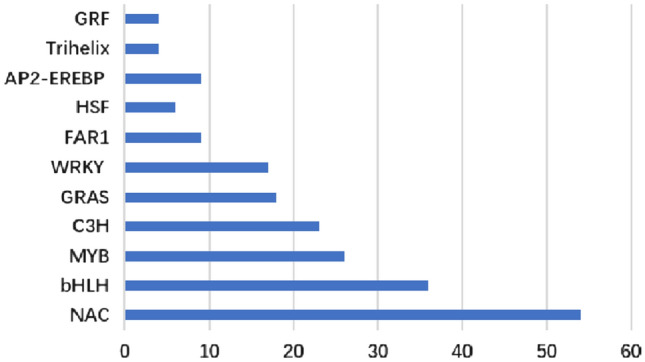
Fig. 3.

Top 11 families of differentially expressed transcription factors response to soil drought stress in faba bean leaves. X axis represents the corresponding number of differentially expressed unigenes in certain transcription factor family. Y axis represents the transcription factor family classification
