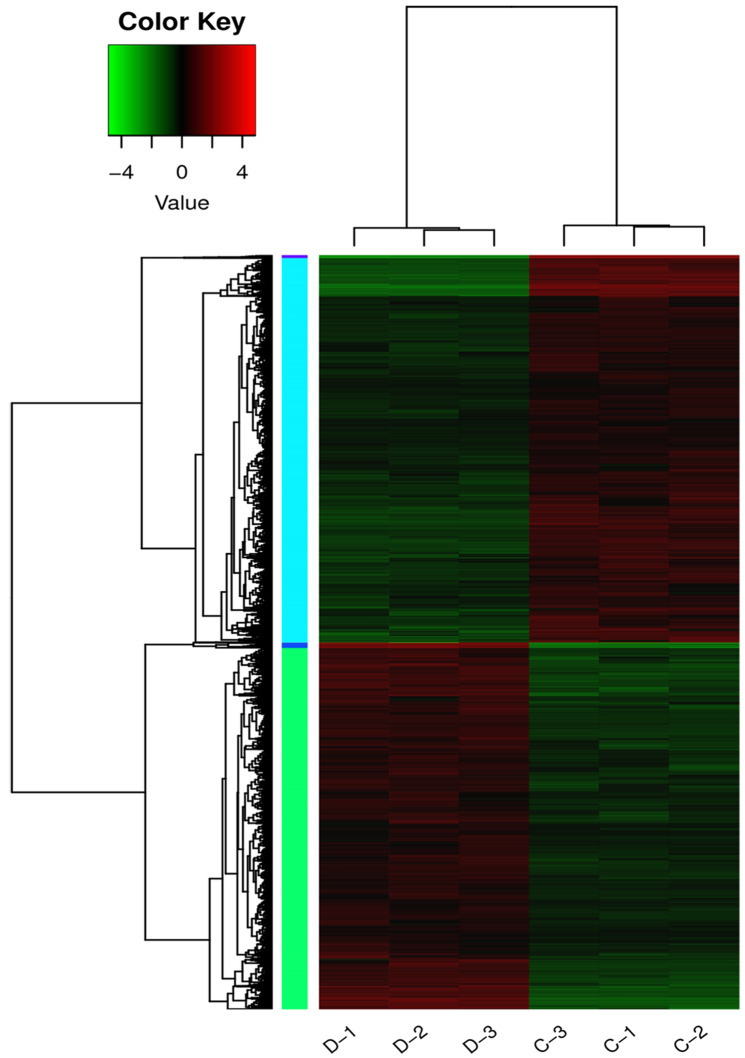
Fig. 4.
A hierarchical clustering heat map showing DEGs identified in the transcriptomes of control samples (three replications:C-1, C-2, C-3) and soil drought-stressed samples (three replications:D-1, D-2, D-3). Relative gene expression fold-changes (log2FPKM) are color coded (red upregulated and green downregulated, the deeper color representing greater difference in relative gene expression)

