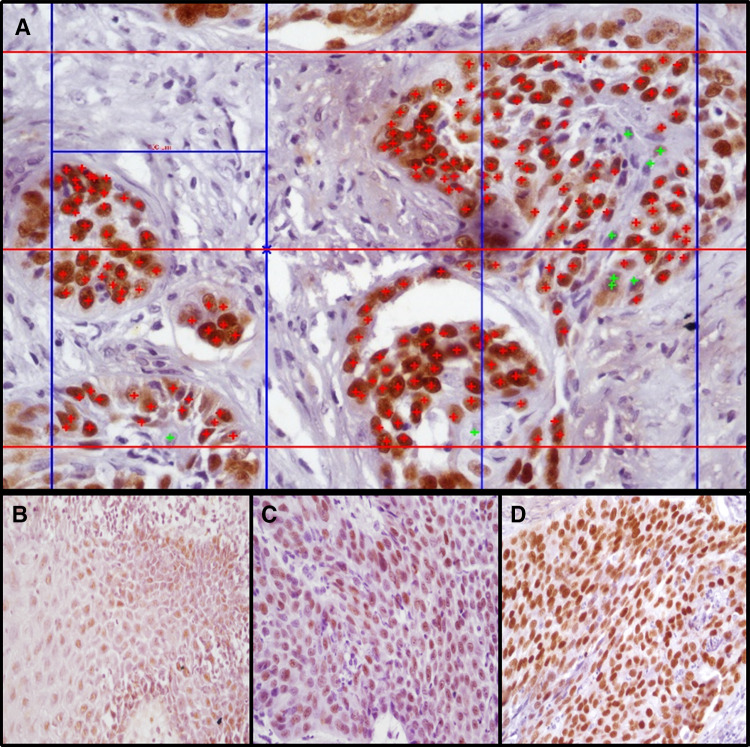
Fig. 1.
a Photomicrograph depicting grid aided image analysis for calculation of percentage expression of SOX2 and OCT4 upon immunohistochemistry (400X, positive cells tagged red+ , negative cells tagged green+). b–d Photomicrographs showing scoring grades of intensity (b-weak, c-moderate, d-strong)

