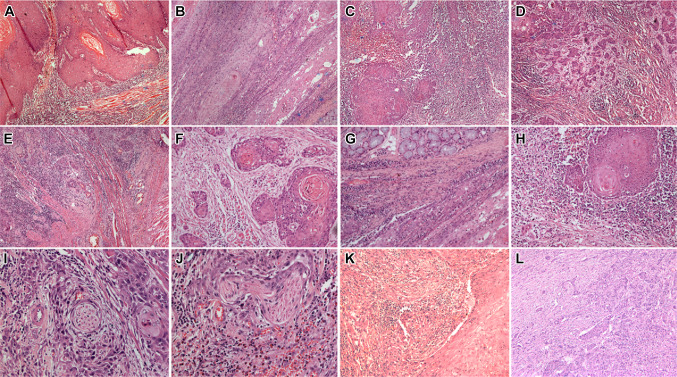
Fig. 1.
Microphotographs showing oral squamous cell carcinoma with A-E: worst pattern of invasion 1 (a), 2 (b), 3 (c), 4 (d), and 5 (e); f, g and h show intensity of lymphocytic infiltrates from 1 + , 2 + to 3 + ; i depicts PNI in small nerve and j in a large nerve; k shows large vessel invasion and l shows small vessel invasion (H&E × 100 × digital magnification)

