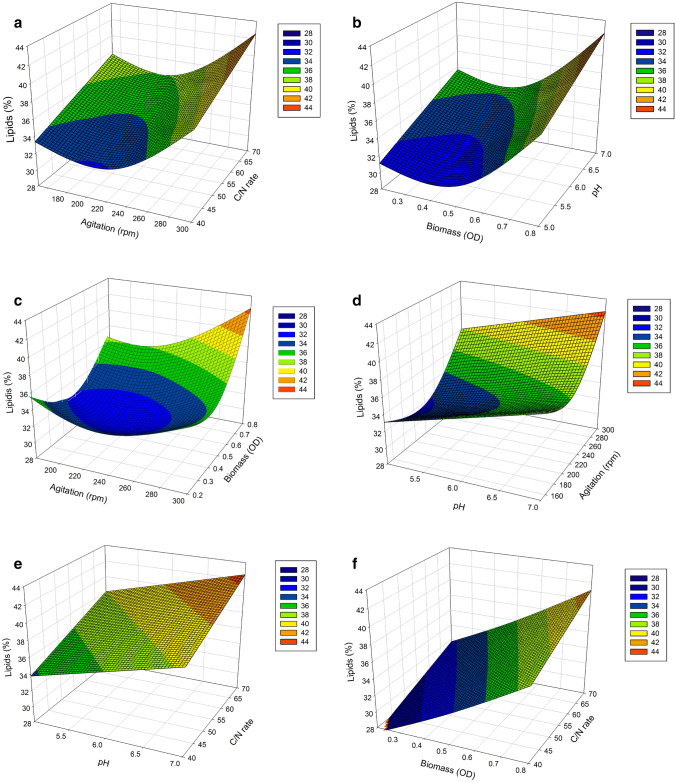
Fig. 2.
Responses surfaces of lipid contents [% (w/w)] as a function of: a agitation and C/N ratio, b biomass and pH, c agitation and biomass, d pH and agitation, e pH and C/N ratio, and f biomass and C/N ratio. For an analysis of the effect of factors two to two on lipid content response the other factors were fixed at their higher coded levels (C/N ratio = + 1, biomass = + 1, agitation = + 1, and pH = + 1). Gradient color legends correspond to the variation in lipid contents [% (w/w)]. Blue and red surfaces represent the lowest and highest responses, respectively

