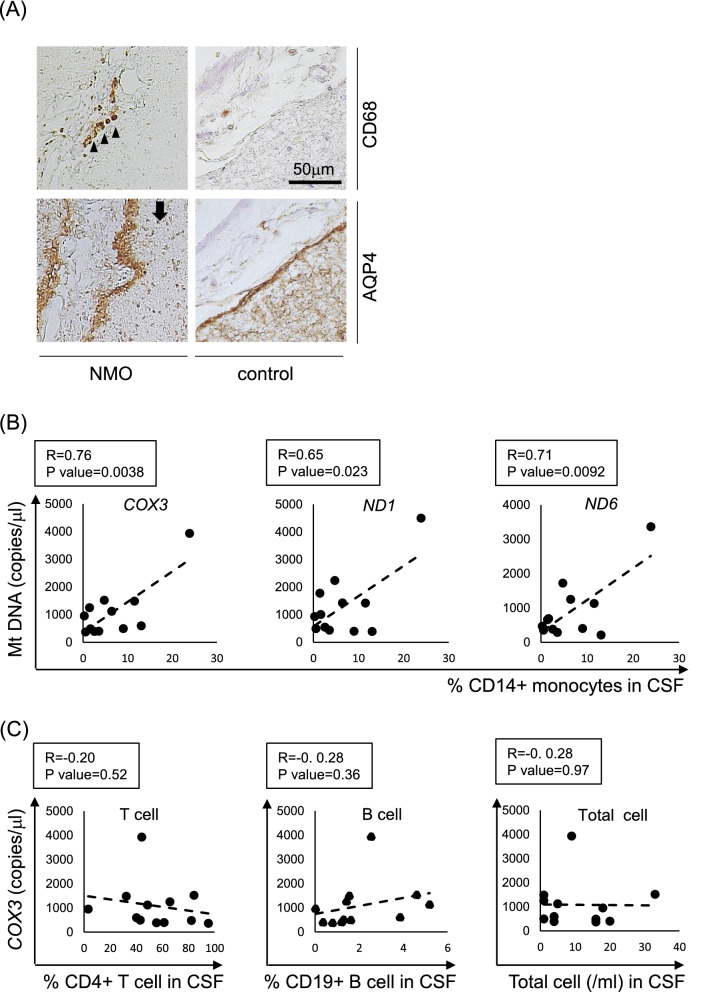
Figure 4.
Preferential recruitment of monocyte is observed at the active lesions of NMOSD and the CSF monocyte count correlates with mitochondrial DNA levels in NMOSD patients. (A) In the NMOSD brain parenchyma, CD68-positive monocytes are detected at the subarachnoid space (arrow heads) where the loss of AQP4 staining is observed (arrow) (left column). In control brain, CD68-positive monocytes are absent where the AQP4 expression is preserved (right column). (B) MtDNA gene levels show positive correlation with the percentage of CD14+monocytes in NMOSD patients’ CSF. (C) COX3 gene expression level does not show significant correlation with the percentage of CD4+ T cells, CD19+ B cells, or the number of total cells in the NMOSD patients’ CSF. Scale bar: 50 µm

