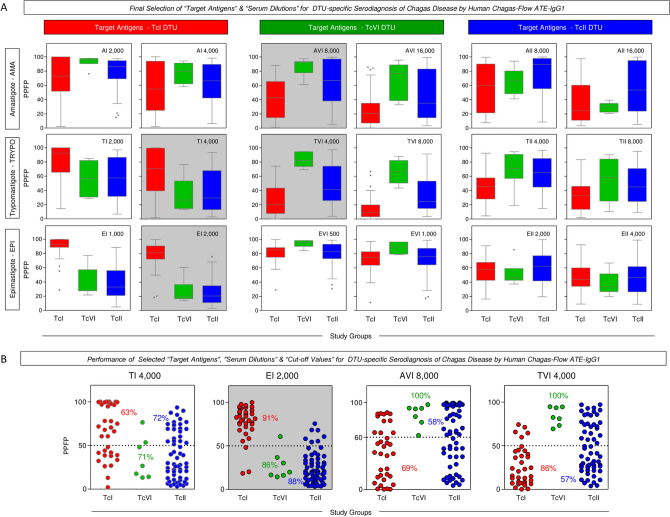
Figure 5.
Final selection of target antigens and serum dilutions for DTU-specific serodiagnosis of Chagas disease by Human Chagas-Flow ATE-IgG1. (A) Multiple comparison of median IgG1 reactivity carried out to define sets of attributes with better performance to segregate the IgG1 reactivity observed for Chagas disease patients infected with TcI (red, n = 35), TcVI (green, n = 7) and TcII (blue, n = 60). The results are expressed as the percentage of positive fluorescent parasites (PPFP) in box plot format, stretching from minimum to maximum values with outliers represented by dots and the box defining the interquartile range (25th and 75th) and the median value (line across the box). Comparative analyses were performed by the Kruskal–Wallis followed by Dunn’s post test for multi-group comparisons. The pairs of attributes “TI 4,000”, “EI 2,000”, “AVI 8,000” and “TVI 4,000” were selected as the most outstanding for DTU-specific diagnosis, according to the lower extent of overlap of interquartile ranges amongst patients infected with TcI, TcVI and TcII T. cruzi DTUs. (B) Scatter plots distributions of selected set of attributes (“target-antigen/serum dilution/cut-off”) to discriminate the reactivity of serum samples amongst Chagas disease patients (TcI, TcVI and TcII). The results were expressed as the range of PPFP values in scatter plots for individual serum samples. The dotted line represents the cut-off for each target-antigen/serum dilution. Median values of PPFP range were used to define the cut-off edge to discriminate positive and negative results. Gray background highlighted the performance of “EI 2,000/50%” as the set of attributes with higher co-positivity for patients infected with TcI (91%) and co-negativity for patients infected with TcVI and TcII (86% and 88%, respectively).

