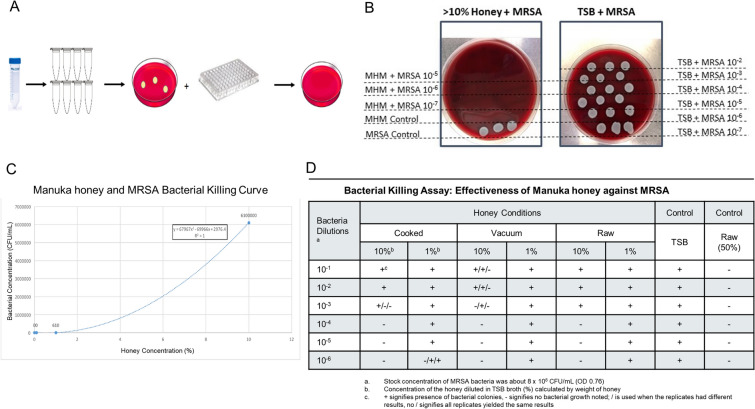
Figure 3.
Antibacterial effects of Manuka honey. (A) Flow diagram of the experimental set-up for the co-culture of MRSA bacteria and Manuka honey preparations. First the bacteria and honey conditions are mixed and serial dilutions are made. One aliquot of these dilutions are plated to verify growth and purity of the bacterial culture and the other aliquot is seeded in a 96-well plate for overnight culture. The following day, these are plated and cultured overnight. (B) Representative photographs of a > 10% Manuka honey positive control on the left and a negative control, TSB only, on the right. As expected, there is no growth in the honey conditions but there is copious growth in the negative control. (C) A bacterial killing curve was graphed based on the 24-h colony counts of various concentrations of Manuka honey and MRSA. (D) Table of the colony counts for each condition in triplicate demonstrating bactericidal properties of Manuka honey at 10% but not at 1%. "+" represents bacterial growth and "−" represents no bacterial growth. Single “ + ” and “–” represents consistent results between replicates, while “ + ” and “–” separated by “/” indicates variable results between replicates.

