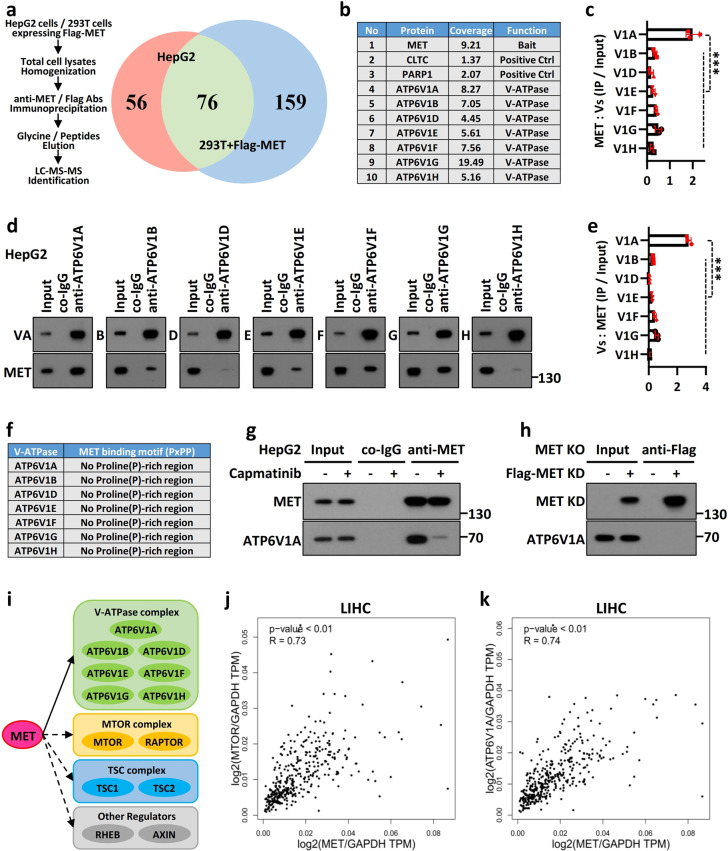
Fig. 5. V-ATPase was identified as a novel protein interacting with MET in the MTOR complex.
a Mass spectrometric analysis of MET immunoprecipitates. HepG2 cells and 293T cells expressing Flag-MET were individually subjected to immunoprecipitation, and potential MET-interacting proteins interactors were identified by LC–MS/MS. Left: workflow; right: Venn diagram. b Representative MET-interaction candidates, including positive controls, are listed as indicated. c MET interacts with the lysosomal V-ATPase complex. Lysates from HepG2 cells were subjected to immunoprecipitation with anti-MET antibody or co-IgG. The ratio of each subunit in the V-ATPase complex that was immunoprecipitated with MET is shown as indicated. d MET binds to the ATP6V1A subunit in the V-ATPase complex. Lysates from HepG2 cells were subjected to immunoprecipitation with antibodies against the subunits of V-ATPase or co-IgG. e The ratio of MET to each subunit of the V-ATPase complex that was immunoprecipitated is shown as indicated. f MET interacts with the V-ATPase complex in a noncanonical manner. Detailed sequence analyses of the V-ATPase complex showing no conserved MET-binding PxPP motif. g Inhibition of MET phosphorylation disrupts the MET–V-ATPase interaction. HepG2 cells were individually treated with or without 50 nM capmatinib for 2 h. Cell lysates were subjected to immunoprecipitation and immunoblotting with the indicated antibodies. h MET-KD mutant lost the ability to interact with V-ATPase. MET-KO HepG2 cells were individually transfected with the MET-KD mutant or vector control for 36 h and then subjected to an immunoprecipitation assay. i MET is a critical component of the MTOR complex. The schematic landscape of MET-interacting proteins was adapted from the MS spectra, the FpClass and STRING databases. Solid arrows denote the proteins that were identified with MS, and the dashed lines indicate the potential interactions predicted through database analysis. j MET correlates with MTOR in LIHC (TCGA, n = 369). k MET correlates with ATP6V1A in LIHC (TCGA, n = 369). GAPDH was applied as a control in the correlation analysis to normalize gene expression at the RNA level.

