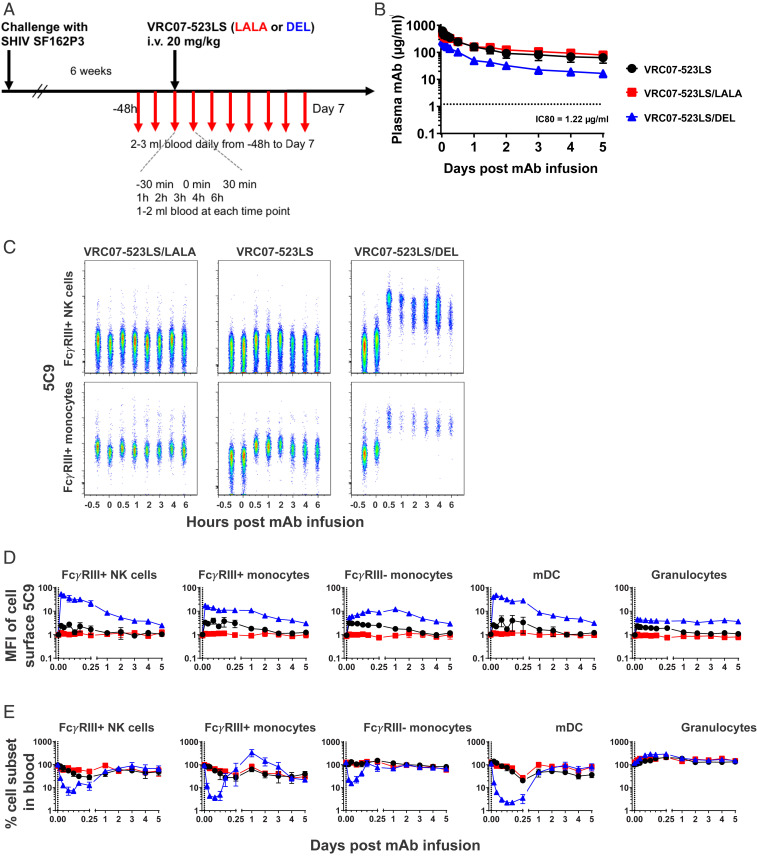
Fig. 2.
Circulating and cell-bound antibody pharmacokinetics. (A) Experimental scheme of SHIV challenge, antibody treatment, and biosampling in rhesus macaques. (B) Plasma levels of antibodies measured by binding to RSC3. Horizontal dotted lines indicate IC80 of neutralization of SHIVSF162P3 by VRC07-523LS. n = 9, 10, and 10 for LS, LS/LALA, and LS/DEL, respectively. Data are mean ± SD. (C) Representative comparison of anti-Id staining and cell-subset levels on NK cells and CD16+ monocytes up to 6 h after antibody treatment. (D) Levels of cell-surface-bound NAb. The y axis represents the median fluorescent intensity on the detection channel of the anti-Id (5C9) used to detect the infused NAb, normalized to baseline at 30 min preinfusion. Data are mean ± SEM. n = 4, 5, and 4 for LS, LS/LALA, and LS/DEL, respectively. (E) Changes in cell-subset frequency normalized to baseline at 30 min preinfusion. Data are mean ± SEM. n = 5, 5, and 4 for LS, LS/LALA, and LS/DEL, respectively.

