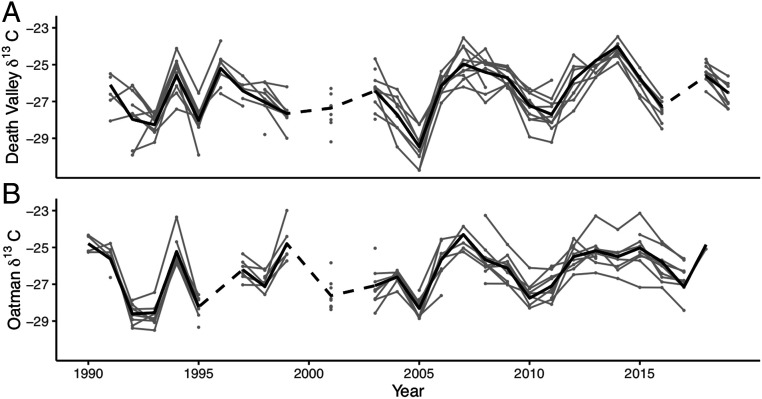
Fig. 2.
Leaf δ13C values (per mil) of 10 long-lived E. farinosa plants from the (A) Death Valley and (B) Oatman populations vary over time and in a similar manner among plants. The black line represents the population mean, and the gray lines and points represent individual plants. Dashed lines connect the population mean across years without isotope data.

