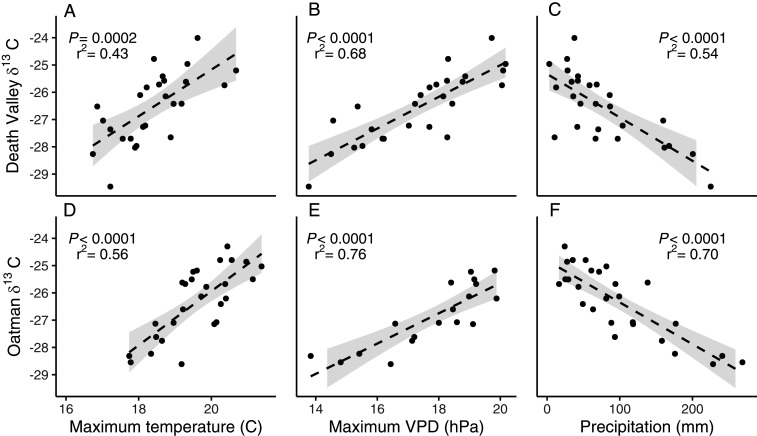
Fig. 3.
Leaf δ13C values (per mil) of E. farinosa in the Death Valley population are positively related to (A) maximum daily temperature and (B) maximum daily VPD, and negatively related to C total precipitation over the November-to-March growing season. δ13C values in the Oatman population follow the same patterns; they are positively related to (D) temperature and (E) VPD, and negatively related to (F) precipitation. Light gray bands represent the 95% CI of the regressions.

