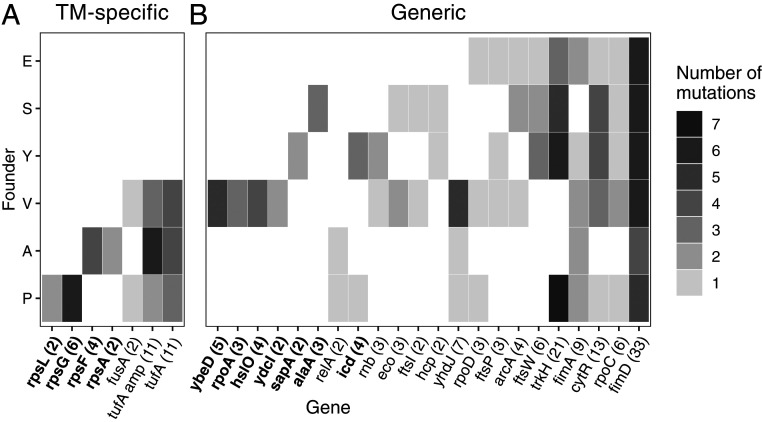
Fig. 4.
Distribution of putatively adaptive mutations across genetic backgrounds. Heat map of all putatively adaptive mutations identified via whole-genome sequencing, grouped by founder and by gene. (A) Translation-associated genes. Amplifications of the tufA locus are counted separately from other mutations in tufA. (B) All other genes. Genes in bold are those where mutations were detected in significantly fewer founders than expected by chance (P < 0.05, Benjamini–Hochberg correction; Materials and Methods). Numbers in parentheses indicate the total number of mutations in each gene observed across all sequenced populations.

