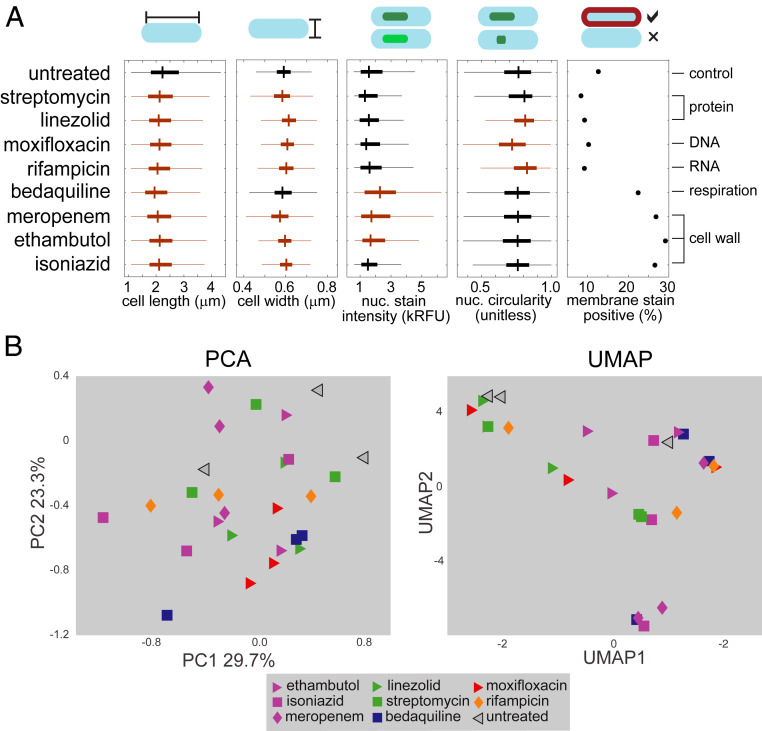
Fig. 1.
Drug treatment induces subtle morphological changes in Mtb. (A) A comparison of select Mtb morphological features across eight antibiotic treatments and untreated control (n = 1,625 to 3,983). The boxes mark the 25th to 75th percentiles, and the whiskers extend the range of parameters that are not outliers. Orange boxes indicate P < 0.05 compared to untreated control (at the top), whereas black boxes are not significantly different from untreated using a Kruskal–Wallis test. (B) PCA (Left), and UMAP (Right) of eight drug treatments at high dose (3× IC90) resulting from established analysis methods (7–9, 47) using feature medians. The treatment nodes are color coded based on the known broad cellular target as determined by literature review (SI Appendix, Table S1).

