Fig. 2.
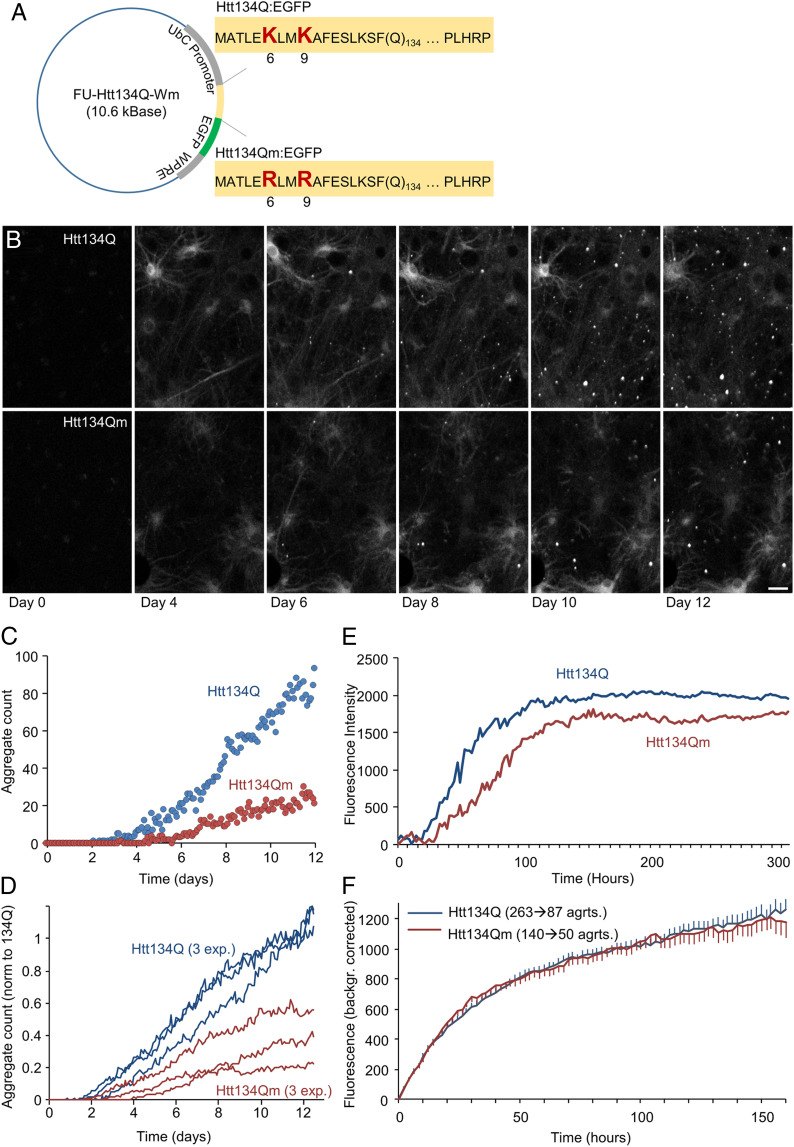
Site-specific ubiquitination of Htt134Q:EGFP N-terminal domain affects aggregates’ numbers and sizes but not their growth kinetics. (A) Schematic of FU-Htt134Q:EGFP-Wm and FU-Htt134Qm:EGFP-Wm coding vectors. The first 17 amino acids are followed by 134 glutamine residues and a proline rich domain (PLHRP) which is fused to EGFP. Upper sequence is from FU-Htt134Q:EGFP-Wm; native lysine residues at positions 6 and 9 shown in red large letters. Lower sequence is from FU-Htt134Qm:EGFP-Wm; lysine-to-arginine–mutated residues at positions 6 and 9 shown in red large letters. (B) Time-lapse images of cortical neurons following lentiviral transduction with FU-Htt134Q:EGFP-Wm or FU-Htt134Qm:EGFP-Wm. Times posttransduction indicated at the bottom. (Scale bar: 20 µm.) (C–F) Quantitative long-term imaging of cortical neurons expressing FU-Htt134Q:EGFP-Wm or FU-Htt134Qm:EGFP-Wm. (C) Changes in aggregate numbers with time from transduction (one region of interest in each condition in a single experiment). (D) Changes in aggregate numbers with time from transduction, three different experiments. Aggregate numbers were normalized in each experiment to the average Htt134Q:EGFP aggregate count at days 11 and 12. (E) Changes in aggregate fluorescence with time from transduction. Averages for three independent experiments. (F) Formation rates of individual aggregates. Individual aggregates were tracked backward in time up until the moment of their appearance. Fluorescence values over time were then obtained for each aggregate and corrected for background fluorescence values measured just before aggregate appearance. All fluorescence trajectories were then aligned to the moment of aggregate appearance, and average trajectories were then calculated (see SI Appendix, Fig. S1 for further details). Based on aggregates tracked in three experiments. Numbers of aggregates indicated above curves. Error bars: SEM.

