Fig. 4.
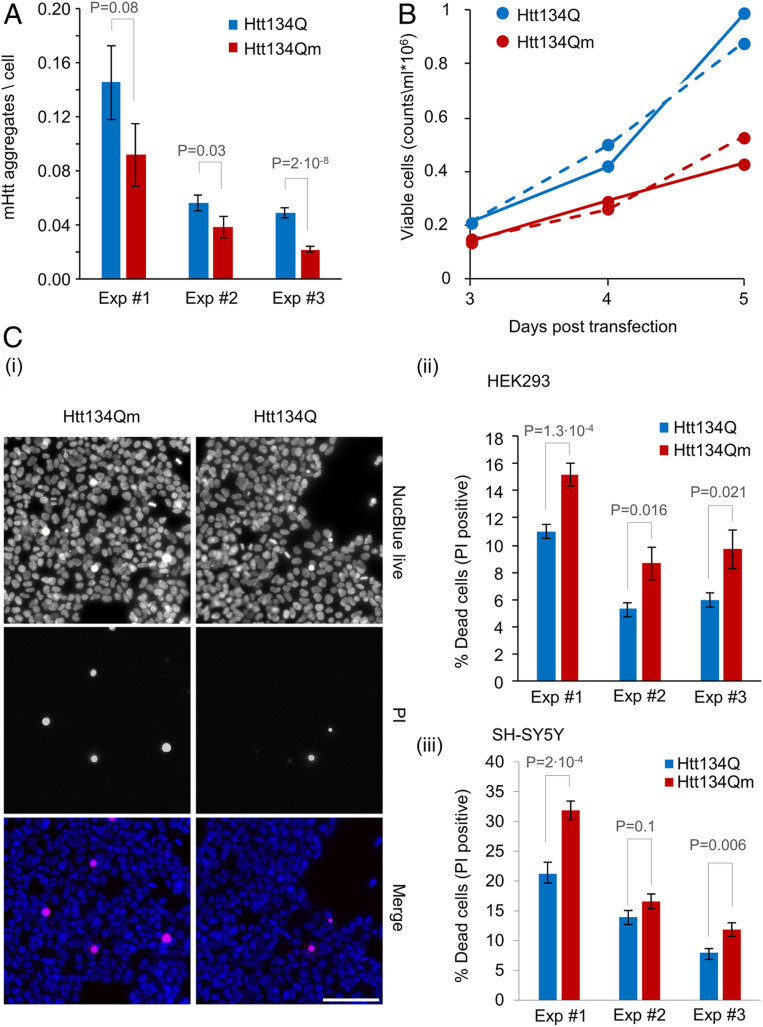
Htt134Q:EGFP ubiquitination alleviates the proteotoxic effects of mHtt. (A) HEK293 cells overexpressing FU-Htt134Q:EGFP-Wm or FU-Htt134Qm:EGFP-Wm were stained with the DNA-binding dye NucBlue, and visualized using an ImageXpress Micro Confocal system. Numbers of mHtt aggregates per cell were calculated as the total number of EGFP-positive aggregates divided by the number of NucBlue-positive cells as described in the SI Appendix, Materials and Methods. Aggregate counts per cell in cells expressing Htt134Q:EGFP or Htt134Qm:EGFP (25 fields of view per well and 49 wells from three independent experiments). (B) HEK293 cells were transfected with FU-Htt134Q:EGFP-Wm or FU-Htt134Qm:EGFP-Wm. The cells were harvested at indicated times following transfection, labeled with Tryptan blue, and live cells were counted by a Vi Cell XR cell counter. The continuous and dotted lines represent two independent experiments. (C) HEK293 and SH-SY5Y cells were transfected with FU-Htt134Q:EGFP-Wm or FU-Htt134Qm:EGFP-Wm. Four days following transfection, the cells were treated with propidium Iodide (PI) and NucBlue reagents and visualized using ImageXpress Micro Confocal system. The percentage of dead cells was calculated as the number of PI-positive cells relative to NucBlue-positive cells. (i) Representative images of PI-positive (red), and NucBlue-positive (blue) HEK293 cells. (ii and iii) Percentage of dead cells in HEK293 (ii) and SH-SY5Y (iii) cells (three independent experiments). Error bars: SEM; P values from two-sample t tests assuming unequal variances are shown (one tailed for A; two tailed for C, ii and iii). (Scale bar in C, i: 100 µm.)

