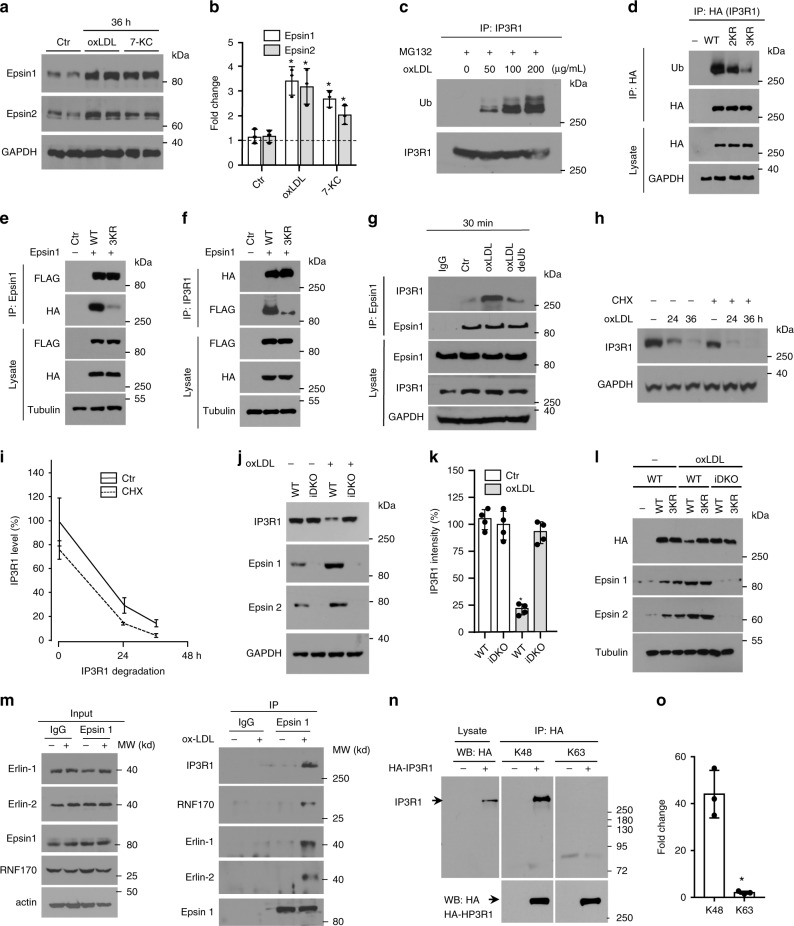
Fig. 3. Epsin 1 modulates IP3R1 degradation through binding to ubiquitinated IP3R1.
a, b Epsin expression in MAECs treated with 100 μg/mL oxLDL or 50 μM 7-KC (36 h). Western blot analysis of epsins (a) and quantification (b) (n = 3, asterisk P < 0.001). c MAECs treated with oxLDL (30 min) in the presence of 5 μM MG132 followed by IP and western blotting for ubiquitin and IP3R1 (n = 5). d HA-tagged IP3R1 containing K126R/K129R (2KR) and K126R/K129R/K143R (3KR) mutations transfected into 293T cells (24 h) were treated with 100 μg/mL oxLDL (30 min), then used for IP and western blot analysis for HA (IP3R1), ubiquitin, and proteins (n = 4). e, f HA-tagged IP3R1 containing 3KR mutations and FLAG-epsin 1 transfected into 293T cells (24 h), were treated with 100 μg/mL oxLDL (30 min), and used for IP and western blot analysis for HA, FLAG, and proteins (n = 4). g MAECs treated with 100 μg/mL oxLDL (30 min) followed by IP and western blot analysis for epsin 1. Lysates were treated with 10 μM of deubiquitinase (deUb) USP2 (n = 4, asterisk P < 0.05 vs. oxLDL). h, i MAECs treated with 100 μg/mL oxLDL for 0, 24, and 36 h ± 10 μg/mL cyclohexamide (CHX). Western analysis for IP3R1 (h) and quantification (i) (n = 5). j, k MAECs isolated from ApoE−/− (WT) or EC-iDKO/ApoE−/− (iDKO) mice treated with 100 μg/mL oxLDL (36 h) were analyzed by western blotting for IP3R1 (j) and quantified (k) (n = 4, P < 0.001). l HA-tagged wild-type (WT) or 3KR IP3R1 transfected control (WT) or iDKO MAECs were treated with 100 μg/mL oxLDL (30 h). Lysates were analyzed by western blotting for HA (IP3R1), epsins, and tubulin (n = 5). m MAECs treated ±100 μg/mL oxLDL (4 h) in the presence of 10 µM MG132, followed by epsin 1 IP and immunoblotting (n = 3). n HA-tagged IP3R1 transfected 293T cells were treated with 100 μg/mL oxLDL (4 h) in the presence of 10 µM MG132. HA immunoprecipitated lysates were analyzed for K48 or K63 (n = 3, asterisk P < 0.0001). Data was assessed using Student’s t-test and presented as mean ± SEM. o Quantification of K48 or K63 ubiquitination of transfected IP3R1 (n = 3. asterisk P < 0.001).

