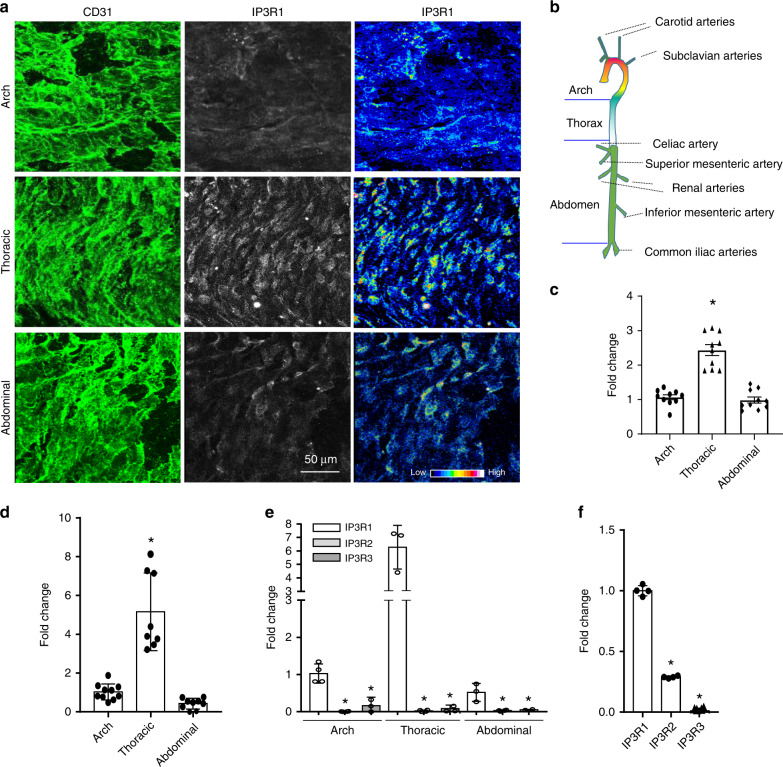
Fig. 6. Abundance of IP3R1 in different regions of the aorta.
a Whole mount en face immunofluorescence staining, followed by confocal imaging. 0.5 μm optical sections of the endothelium were imaged. CD31 staining shows the endothelial cell surface and IP3R1 staining of the same optical sections is shown (left and center panels). The fluorescence intensity of IP3R1 staining of sections from the aortic arch, thoracic aorta, and abdominal aorta is also depicted (right panels). b A schematic diagram of the aorta highlighting the regions of analysis. c Quantification of IP3R1 immunofluorescent staining distribution in aortas (thoracic aorta vs. aortic arch and abdominal aorta, n = 10 microscopic fields captured for each segments, asterisk P < 0.01). d RT-PCR analysis of IP3R1 abundance in the aortic arch, thoracic aorta, and abdominal aorta (thoracic aorta vs. aortic arch or abdominal aorta, aortic RNA from seven mice was extracted for qPCR analysis, 4 repeats in each reaction, asterisk P < 0.0001). e, f Abundance of IP3R1, IP3R2, and IP3R3 mRNA in the aortic arch, thoracic aorta, and abdominal aorta. RNA was extracted from aortas of seven mice for qPCR analysis, and 4 repeats (e) in each reaction or in MAECs (f). (IP3R1 vs. IP3R2 and IP3R3, n = 3 independent experiments, asterisk P < 0.0001). All data were assessed using Student’s t-test and are presented as the mean ± SEM.

