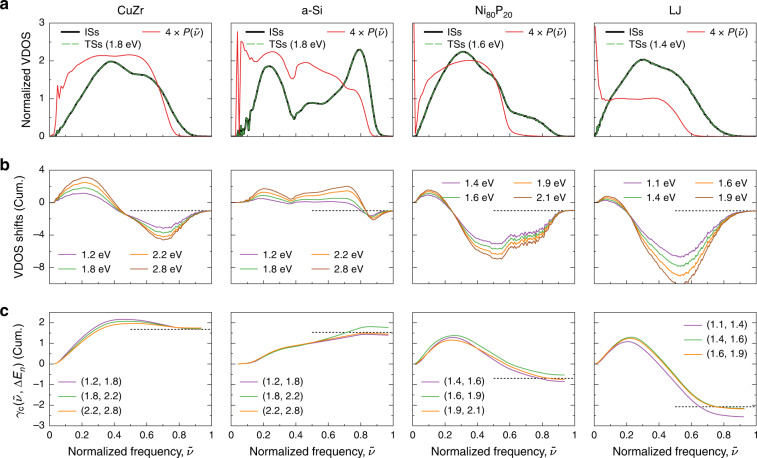
Fig. 2. Vibrational origin of compensation and anti-compensation.
a Normalized VDOS averaged over all ISs (black lines) and most probable TSs (green dashed lines), as a function of normalized frequencies , with ν0 equal to 9, 20, 15, and 7.5 THz for CuZr, a-Si, Ni80P20, and LJ, respectively. Red lines represent mode participation ratios (“Methods”), averaged over frequencies and ISs, and multiplied by four so that their values can be read on the y axis used for normalized VDOS. b Cumulative VDOS shifts between TSs— whose activation energy lies in the energy bin centered at ΔEn—and ISs. They converge to −1 (black dotted lines). Legends indicate approximate values of ΔEn, and line colors correspond to colors of dots in Fig. 1b. c Cumulative contributions of vibrational modes to local compensation factors (slopes of the line connecting two consecutive dots in Fig. 1b; these dots lie around the energies (ΔEn, ΔEn+1) given in legends). They converge around the global compensation factors γc (black dotted lines).

