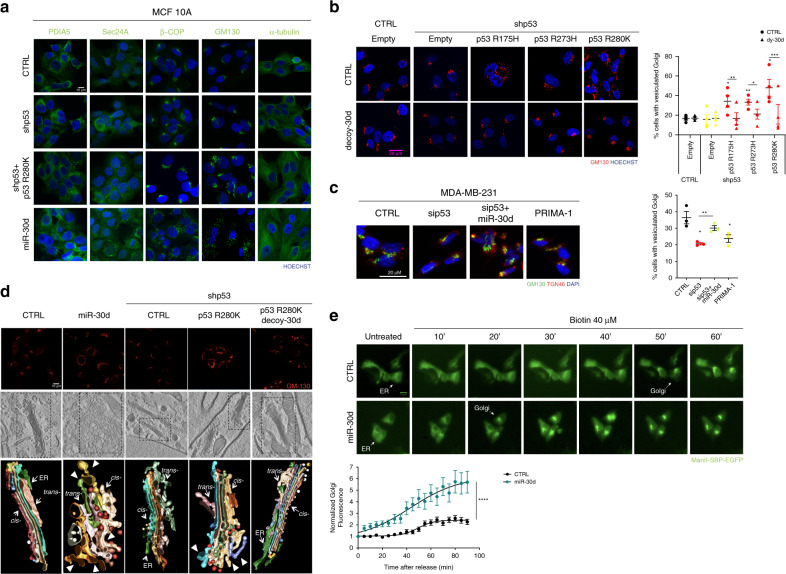
Fig. 3. The mut-p53/miR-30d axis modifies the cell secretory machinery.
a Immunofluorescence analysis of PDIA5 (ER), SEC24 (COPII), βCOP (COPI), GM130 (cis-Golgi), and α-tubulin (microtubules) in MCF10A cells, upon stable silencing of endogenous wild-type p53 (shp53) either alone or combined with overexpression of mut-p53 R280K or miR-30d mimic. Nuclei were stained with Hoechst. Scale bar, 20 µm. b Immunofluorescence analysis of Golgi apparatus stained with an antibody specific for GM130 in MCF10A cells stably silenced for endogenous p53 (shp53) and overexpressing mut-p53 R175H, R273H, or R280K forms, and transduced either with control or miR-30d decoy construct. Scale bar, 20 µm. Right: graph showing the percentage of cells with vesiculated Golgi upon different treatments. c Immunofluorescence analysis of Golgi apparatus stained with an antibody specific for GM130 in MDA-MB-231 cells upon silencing of mut-p53, overexpression of a miR-30d mimic, their combination or treatment for 24 h with 10 µM PRIMA-1 as indicated. Scale bar, 20 µm. Right: graph showing the percentage of cells with vesiculated Golgi upon different conditions. d Top: confocal superresolution microscopy analysis of Golgi structure in MCF10A cells subjected to the indicated treatments, and stained for GM130 antigen. Middle: electron tomography of the above samples. Bottom: three-dimensional model of the Golgi stacks highlighted in the middle panels, showing the Golgi cisternae. Arrowheads indicate vesicular-tubular clusters in cells overexpressing miR-30d or mut-p53 R280K. e Images show the cellular localization of the RUSH reporter MannII-SBP-EGFP at the indicated time points after addition of biotin in MCF10A cells transfected with either CTRL or miR-30d mimic. Scale bar, 20 µm. Bottom: plots show total fluorescence intensity in the Golgi region at each time point, corrected for background and normalized to the fluorescence before release. Curves depict the measurement of 20 cells for each condition. Time per condition p value <0.0001 was calculated by two-way ANOVA test. In (b–d) graphs represent the individual data points and the mean +/− SEM of three independent experiments. P value (*p < 0.05, **p < 0.01, ***p < 0.001) was calculated by two-tailed unpaired Student’s t-test). Micrographs are representative of n = 3 biological replicates. Source data are provided as Source data file.

