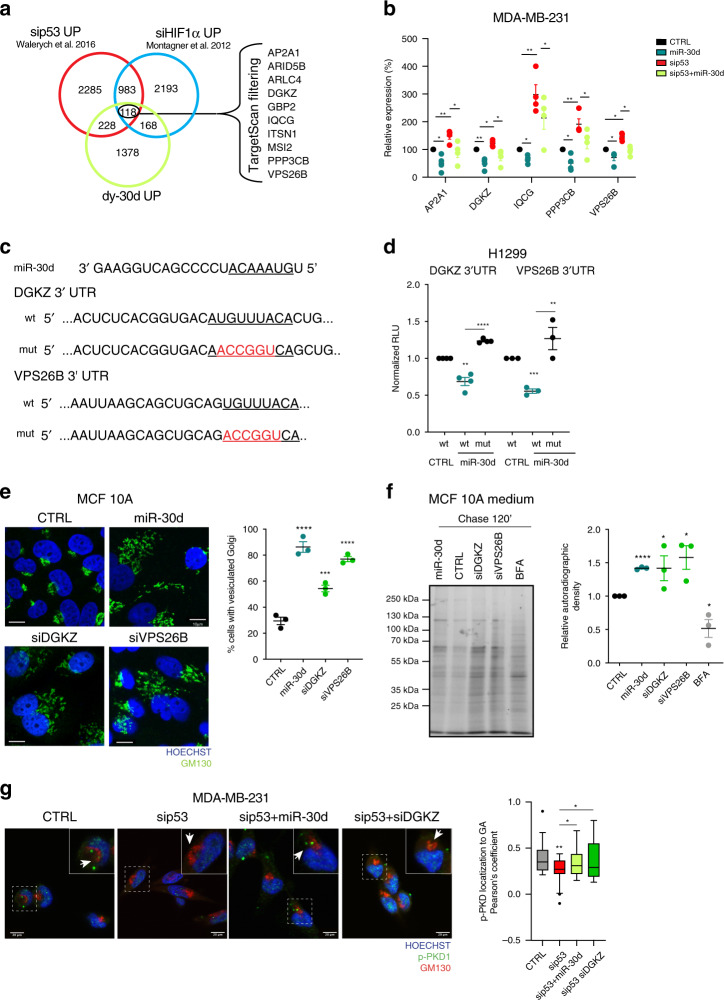
Fig. 4. miR-30d alters the secretory pathway via DGKZ and VPS26B.
a Venn diagram illustrating the overlap between transcripts upregulated by miR-30d inhibition (decoy-miR-30d UP), mut-p53 depletion (sip53 UP30), and HIF1α depletion (siHIF1a UP33) in the MDA-MB-231 cell line. Common genes that are predicted miR-30d targets by TargetScan algorithm are listed. b Expression of indicated mRNAs in MDA-MB-231 cells transfected with either miR-30d mimic, mut-p53 siRNA, or their combination was analyzed by RT-qPCR, normalized to H3 expression. c Top: miR-30d sequence. Bottom: sequences of the 3′UTR regions of DGKZ and VPS26B. The miR-30d seed sequences are underlined, mutagenized sequences in the constructs are indicated in red. d Luciferase assays were performed in H1299 cells with reporter plasmids as described in (c); reporter plasmids were co-transfected with control (CTRL) or miR-30d expression constructs. Firefly luciferase expressed by the same plasmid was used to normalize for transfection efficiency. e Immunofluorescence analysis of Golgi morphology by staining for GM130 in MCF10A cells upon overexpressing miR-30d mimic or silencing DGKZ or VPS26B. Nuclei were stained with Hoechst. Scale bar, 20 µm. The graph shows the percentage of cells with vesiculated Golgi structure upon different treatments. f Analysis of total protein secretion in MCF10A cells after overexpression of miR-30d mimic, or silencing of DGKZ or VPS26B, and metabolically labeled with [35S]-methionine/cysteine aminoacids. Labeled proteins were resolved by SDS-PAGE and detected by autoradiography (representative of n = 3 biological replicates). Treatment with 2.5 μM BFA was used as a control. Right: graph showing the ratio of secreted versus intracellular labeled proteins quantified by densitometry (corresponding intracellular proteins are shown in Supplementary Fig. 4f). g Co-localization of phosphorylated PKD (pPKD) with the Golgi marker GM130 in MDA-MB-231 cells upon mut-p53 knockdown (sip53), and either introduction of miR-30d mimic or DGKZ silencing (siDGKZ). Scale bar, 20 µm. The bloxplot shows the Pearson’s correlation coefficient for pPKD Golgi localization (n = 25 cells for each condition), median and whiskers calculated with Tukey method. Graphs represent the individual data points, mean +/− SEM of three independent experiments. P value (*p < 0.05, **p < 0.01, ***p < 0.001, ****p< 0.0001) was calculated by two-tailed unpaired Student’s t-test). Source data are provided as Source data file.

