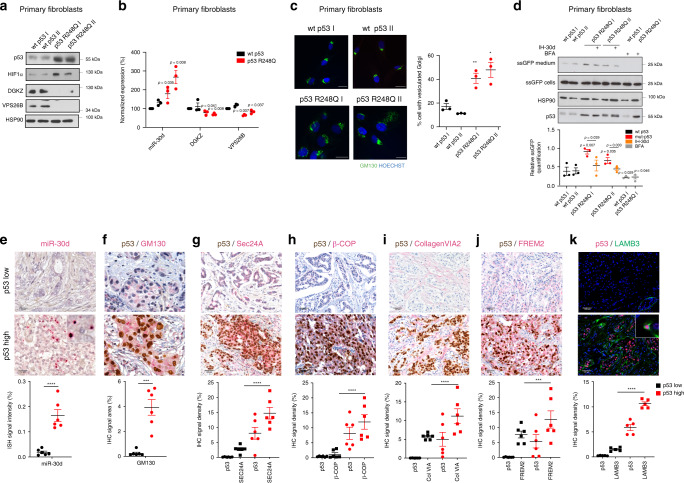
Fig. 7. Impact of mut-p53/miR-30d axis in clinical samples.
a Analysis of DGKZ, VPS26B, and p53 protein levels in Human Primary Fibroblasts with different p53 status as indicated. HSP90 was used as loading control. The blot is representative of n = 3 biological replicates. b miR-30d, DGKZ, and VPS26B expression was evaluated in Human Primary Fibroblasts with different p53 status as indicated by RT-qPCR, normalized to U6B and H3 RNA expression levels. Exact p values are indicated in the figure. c Immunofluorescence analysis of Golgi apparatus stained with an antibody specific for GM130 in human primary fibroblasts with different TP53 status as indicated. Right: graph showing the percentage of cells with vesiculated Golgi upon different treatments. d Human Primary Fibroblasts with the indicated TP53 status were transfected with a plasmid encoding green fluorescent protein fused to a secretion signal sequence (ssGFP). Intracellular (cells) and extracellular (medium) GFP protein levels were analyzed upon transfection of miR-30d inhibitor (IH-30d). Forty-eight hours upon silencing, fresh medium was added to the cells and collected after 2 h for analysis. Treatment with BFA 2.5 μM for 2 h was included as control. Densitometric quantification of the ratio of secreted versus intracellular ssGFP is shown in the graph below. All blots are representative of n = 3 biological replicates. Exact p values are indicated in the figure. e–k Representative images of immunohistochemical (IHC) analysis of breast cancer samples divided on the basis of p53 missense mutation as inferred by p53 staining and allele-specific PCR (n = 6 for each condition). Samples were stained with anti-p53 antibody combined with miR-30d in situ hybridization by BaseScope (e) or with anti-GM130 (f), anti-Sec24A (g), anti-β-COP (h), Collagen-VI A2 (i), FREM2 (j), or LAMB3 (k) antibodies. The graphs below report the relative quantification of the antigens analyzed. All graphs report single data points, mean +/− SEM; p value (*p < 0.05, **p < 0.01, ***p < 0.001, ****p < 0.0001) was calculated by two-tailed unpaired Student’s t-test. Blots are representative of n = 3 biological replicates. Source data are provided as Source data file.

