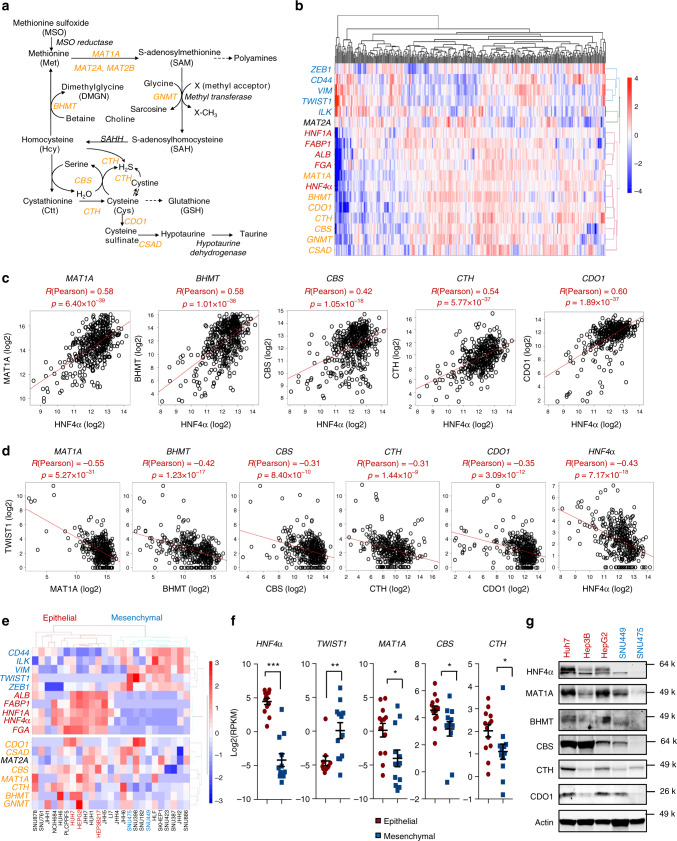
Fig. 1. Key SAA metabolic enzymes and HNF4α are correlated in liver cancers.
a SAA metabolic pathways. MAT1A methionine adenosyltransferase 1A, MAT2A methionine adenosyltransferase 2A, MAT2B methionine adenosyltransferase 2B, GNMT glycine N-methyltransferase, SAHH adenosylhomocysteinase, BHMT betaine-homocysteine S-methyltransferase, CBS cystathionine beta-synthase, CTH/CSE cystathionine gamma-lyase, CDO1 cysteine dioxygenase type 1, CSAD cysteine sulfinic acid decarboxylase. Key SAA enzymes investigated in this study are highlighted in orange. b HNF4α is clustered together with key SAA metabolic enzymes in liver cancer patients. The mRNA levels of HNF4α-regulated liver functional genes (Red), mesenchymal markers (Blue), and key SAA metabolic enzymes (Orange) from 373 liver cancer patients from the TCGA LIHC dataset were clustered and represented by the heatmap as described in Methods. c Expression of key SAA metabolic enzymes is positively correlated with HNF4α expression in liver cancer patients (n = 371). The pair-wise Pearson correlation coefficient and the corresponding p-value between two genes were calculated using MATLAB. Two outlier samples in which HNF4α expression levels were more than 3 interquartile ranges (IQRs) below the first quartile among the 373 samples were removed. d Expression of key SAA metabolic enzymes is negatively correlated with TWIST1 expression in liver cancer patients (n = 373). e HNF4α is clustered together with key SAA metabolic genes in liver cancer cells. The mRNA levels of HNF4α-mediated liver genes (Red), mesenchymal markers (Blue), and SAA metabolic enzymes (Orange) from 25 liver cancer cells from CCLE database were clustered and represented by the heatmap using MATLAB as described in Methods. f Expression of MAT1A, CBS and CTH is significantly higher in HNF4α-positive epithelial liver cancer cells than in HNF4α-negative mesenchymal liver cancer cells. The mRNA levels of indicated genes were analyzed using 25 liver cancer cells from the CCLE database (n = 13 epithelial, 12 mesenchymal). g Protein expression of key SAA metabolic enzymes in 3 selected epithelial and 2 mesenchymal liver cancer cell lines (representative immunoblots are shown from at least three independent experiments). For dot plots in f, dots depict individual cell lines, values are expressed as mean ± s.e.m., two-tailed, unpaired, non-parametric Mann-Whitney test, ***p < 0.001, **p < 0.01, *p < 0.05.

