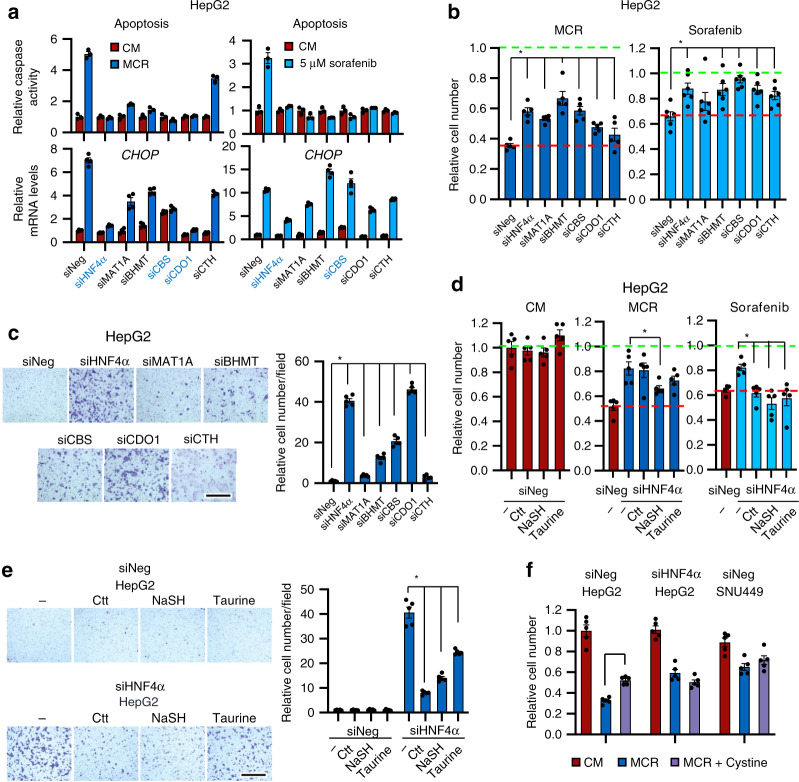
Fig. 7. Transsulfuration metabolic genes affect stress sensitivity and the migration ability of liver cancer cells.
a Knocking down SAA metabolic genes or HNF4α in HepG2 cells confers resistance to MCR-induced and sorafenib-induced stress. Indicated cells were cultured in CM or MCR medium (left) or in CM containing 5 μM sorafenib (right) for 24 h. Apoptosis was analyzed by a caspase activity assay (n = 3 replicates per group) and the expression of CHOP was analyzed by qPCR (n = 4 replicates per group). b Knockdown of SAA metabolic genes or HNF4α in HepG2 cells confers resistance to MCR-induced or sorafenib-induced cell death. Indicated cells were treated as in a (n = 5 replicates per group for MCR and n = 6 replicates per group for sorafenib). The cell number in CM was normalized to 1 (green dotted line), and the cell survival of MCR siNeg cells was denoted by a red dotted line. c Knockdown of SAA metabolic genes or HNF4α in HepG2 cells enhances cell migration. Indicated cells were subjected to a transwell assay as described in Methods (n = 5 replicates per group). The number of migrated siNeg cells was normalized to 1. Bar, 500 μm. d Supplementation of transsulfuration pathway metabolites partially prevents the resistance of HNF4α-depleted cells to MCR and sorafenib. Indicated cells were treated with or without 1 mM Ctt, 1 mM NaSH, or 10 mM taurine for 48 h in CM, then incubated in CM (left), MCR (middle), or CM containing 5 mM sorafenib (right) for additional 24 h. e Supplementation of metabolites in the transsulfuration pathway represses HNF4α depletion-induced cell migration. SiNeg and siHNF4α HepG2 cells were treated and analyzed for cell migration as described in Methods (n = 5 replicates per group). The number of migrated siNeg cells in CM was normalized to 1. Bar, 500 μm. f Addition of cystine partially rescues MCR-induced cell death in HepG2 cells but not in HNF4α-deficient cells. Indicated cells were cultured in CM, MCR, or MCR with 200 μM L-cystine (MCR + cystine) for 24 h (n = 5 replicates per group). For all bar graphs, values are expressed as mean ± s.e.m., two-tailed, unpaired Student’s t-test, *p < 0.05.

