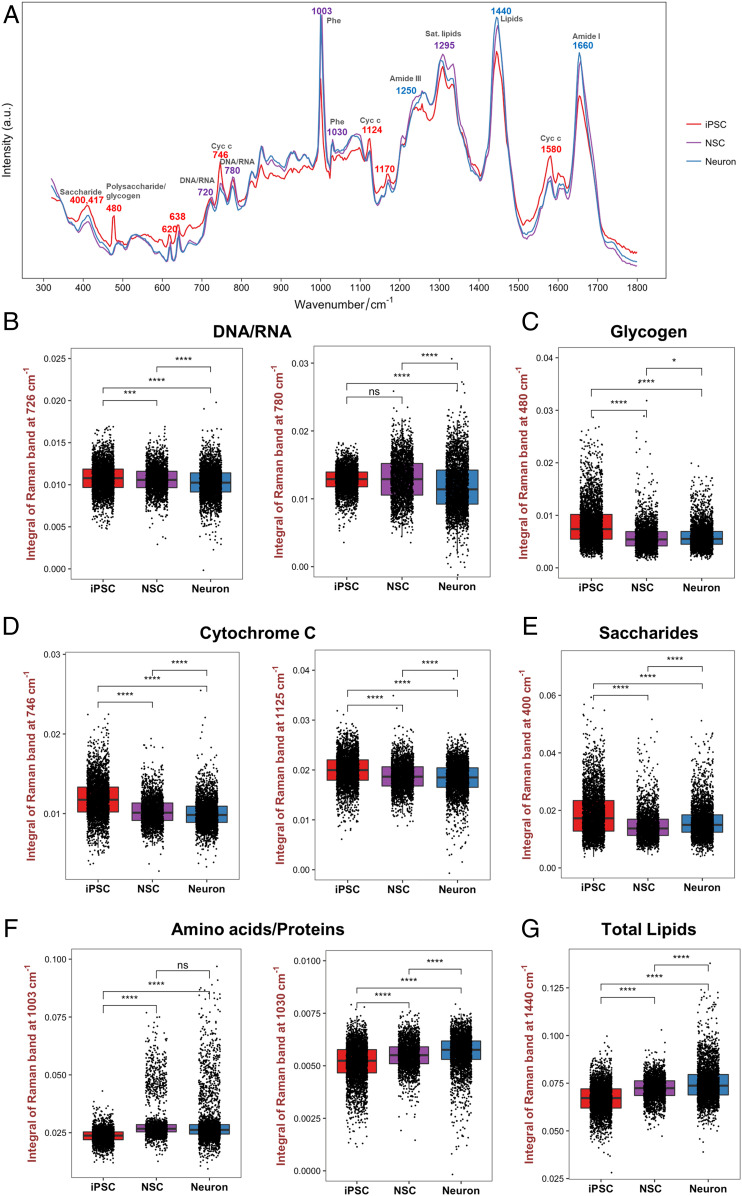
Fig. 3.
Identification of potential biomarkers using SCRS. (A) Average Raman spectra acquired from the hiPSCs (red), NSCs (purple), and neurons (blue) from three different hiPSC lines annotated with Raman bands identified in cell lineage commitment. (B−G) Comparisons of the Raman band intensity between different cell populations were quantified for (B) nucleic acids (726 and 780 cm−1), (C) glycogen (480 cm−1), (D) cytochrome C (746 and 1,125 cm−1), (E) saccharides (400 cm−1), (F) proteins (1,003 and 1,030 cm−1), and (G) total lipids (1,440 cm−1). One-way ANOVA with post hoc Tukey’s test was used. All experiments were performed with three biological replicates comprising three technical replicates with 8,774 Raman spectra acquired from the hiPSCs (n = 3,316), NSCs (n = 2,342), and neurons (n = 3,116). The results represent means ± SEM; * represents P < 0.05, *** represents P ≤ 0.001, **** represents P ≤ 0.0001.

